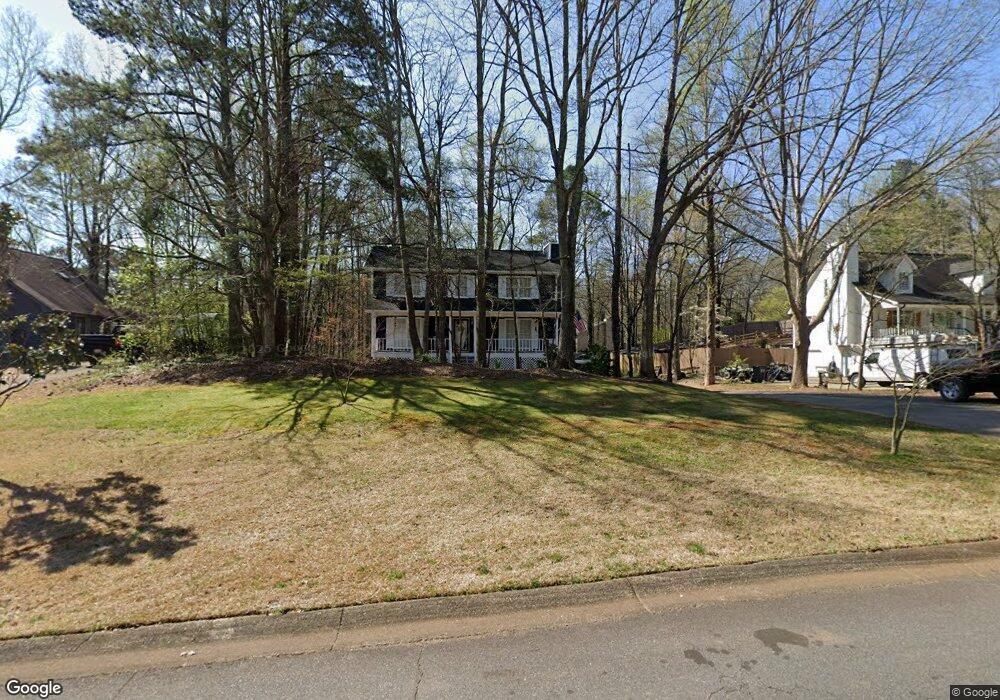
6231 Westridge Trace Acworth, GA 30102
Oak Grove NeighborhoodEstimated Value: $367,000 - $367,857
3
Beds
3
Baths
1,976
Sq Ft
$186/Sq Ft
Est. Value
About This Home
This home is located at 6231 Westridge Trace, Acworth, GA 30102 and is currently estimated at $367,429, approximately $185 per square foot. 6231 Westridge Trace is a home located in Cherokee County with nearby schools including Oak Grove Elementary School, E. T. Booth Middle School, and Etowah High School.
Ownership History
Date
Name
Owned For
Owner Type
Purchase Details
Closed on
Nov 28, 2000
Sold by
Dockery John and Dockery Rhonda L
Bought by
Hensley Rebecca L
Current Estimated Value
Home Financials for this Owner
Home Financials are based on the most recent Mortgage that was taken out on this home.
Original Mortgage
$135,384
Outstanding Balance
$49,020
Interest Rate
7.82%
Mortgage Type
FHA
Estimated Equity
$318,409
Purchase Details
Closed on
Apr 28, 2000
Sold by
Dittmer Robert A and Dittmer Dawn R
Bought by
Dockery John
Home Financials for this Owner
Home Financials are based on the most recent Mortgage that was taken out on this home.
Original Mortgage
$130,100
Interest Rate
8.23%
Mortgage Type
FHA
Purchase Details
Closed on
May 29, 1998
Sold by
Mcelderry William A
Bought by
Dittmer Robert A and Dittmer Dawn R
Home Financials for this Owner
Home Financials are based on the most recent Mortgage that was taken out on this home.
Original Mortgage
$106,875
Interest Rate
6.12%
Mortgage Type
New Conventional
Create a Home Valuation Report for This Property
The Home Valuation Report is an in-depth analysis detailing your home's value as well as a comparison with similar homes in the area
Home Values in the Area
Average Home Value in this Area
Purchase History
| Date | Buyer | Sale Price | Title Company |
|---|---|---|---|
| Hensley Rebecca L | $136,500 | -- | |
| Dockery John | $131,200 | -- | |
| Dittmer Robert A | $112,500 | -- |
Source: Public Records
Mortgage History
| Date | Status | Borrower | Loan Amount |
|---|---|---|---|
| Open | Hensley Rebecca L | $135,384 | |
| Previous Owner | Dockery John | $130,100 | |
| Previous Owner | Dittmer Robert A | $106,875 |
Source: Public Records
Tax History Compared to Growth
Tax History
| Year | Tax Paid | Tax Assessment Tax Assessment Total Assessment is a certain percentage of the fair market value that is determined by local assessors to be the total taxable value of land and additions on the property. | Land | Improvement |
|---|---|---|---|---|
| 2025 | $708 | $144,656 | $30,000 | $114,656 |
| 2024 | $683 | $128,976 | $24,000 | $104,976 |
| 2023 | $738 | $135,056 | $24,000 | $111,056 |
| 2022 | $2,632 | $111,656 | $20,000 | $91,656 |
| 2021 | $2,450 | $94,336 | $14,000 | $80,336 |
| 2020 | $2,178 | $82,536 | $14,000 | $68,536 |
| 2019 | $2,047 | $76,880 | $14,000 | $62,880 |
| 2018 | $1,796 | $65,680 | $12,800 | $52,880 |
| 2017 | $1,652 | $149,000 | $12,800 | $46,800 |
| 2016 | $1,534 | $137,500 | $11,600 | $43,400 |
| 2015 | $1,492 | $132,600 | $10,000 | $43,040 |
| 2014 | $1,365 | $121,600 | $10,000 | $38,640 |
Source: Public Records
Map
Nearby Homes
- 6226 Westridge Trace
- 6222 Westridge Trace
- 6147 Little Ridge Rd
- 6155 Little Ridge Rd
- 6137 Little Ridge Rd
- 206 Cameron Ct
- 536 Rendezvous Rd
- 577 Oakside Place
- 517 Rendezvous Rd
- 320 Oak Leaf Place
- 503 Rendezvous Rd
- 153 Centennial Ridge Dr
- 240 Ridge Mill Dr
- 302 Seth Way
- 313 Maltibie Dr
- 3286 Elwin Ragsdale Way
- Bolton Plan at Cherokee Township
- Brooks Plan at Cherokee Township
- Bryson Plan at Cherokee Township
- 6375 Caladium Dr
- 104 Westland Ct
- 6233 Westridge Trace
- 6227 Westridge Trace
- 6235 Westridge Trace
- 6225 Westridge Trace
- 6238 Westridge Trace
- 102 Westland Ct
- 106 Westland Ct
- 6236 Westridge Trace
- 6223 Westridge Trace
- 105 Westland Ct
- 6234 Westridge Trace
- 107 Westland Ct
- 6221 Westridge Trace
- 6239 Westridge Trace
- 103 Westland Ct
- 6219 Westridge Trace
- 6240 Westridge Trace
- 100 Westland Ct
- 110 Westland Ct