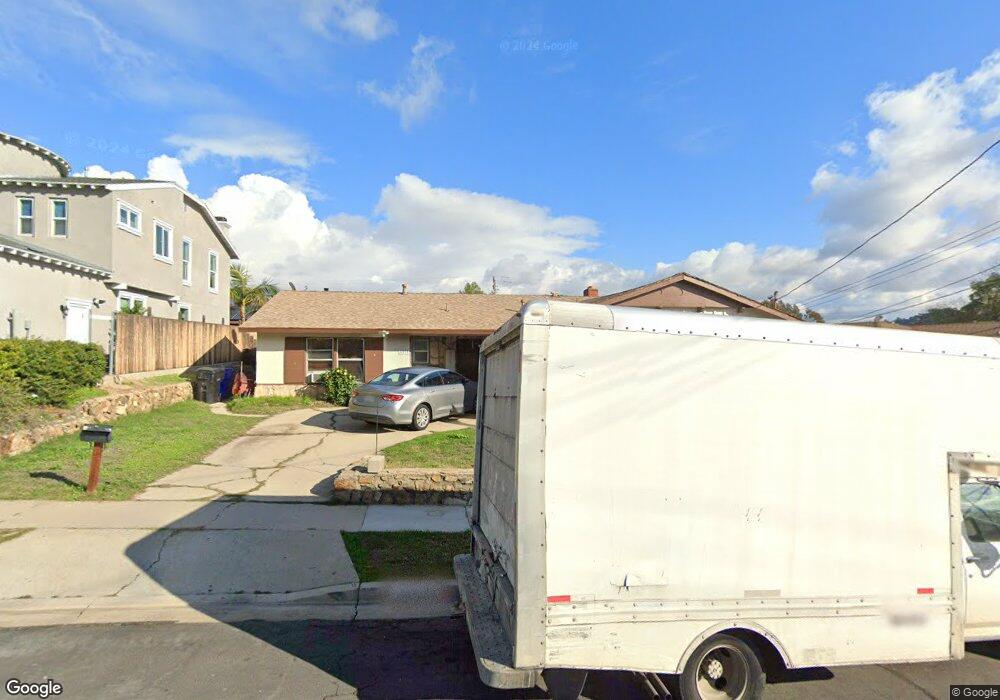
6233 S Lake Ct San Diego, CA 92119
Lake Murray NeighborhoodEstimated Value: $871,706 - $1,041,000
3
Beds
2
Baths
1,598
Sq Ft
$596/Sq Ft
Est. Value
About This Home
This home is located at 6233 S Lake Ct, San Diego, CA 92119 and is currently estimated at $951,677, approximately $595 per square foot. 6233 S Lake Ct is a home located in San Diego County with nearby schools including Gage Elementary School, Pershing Middle School, and Patrick Henry High School.
Ownership History
Date
Name
Owned For
Owner Type
Purchase Details
Closed on
Apr 28, 2004
Sold by
Rosa James
Bought by
Rosa Linda
Current Estimated Value
Home Financials for this Owner
Home Financials are based on the most recent Mortgage that was taken out on this home.
Original Mortgage
$200,000
Outstanding Balance
$92,979
Interest Rate
5.38%
Mortgage Type
New Conventional
Estimated Equity
$858,698
Purchase Details
Closed on
Feb 22, 1996
Sold by
Jacobs Christopher
Bought by
Rosa James and Rosa Linda
Home Financials for this Owner
Home Financials are based on the most recent Mortgage that was taken out on this home.
Original Mortgage
$147,900
Interest Rate
6.98%
Mortgage Type
VA
Purchase Details
Closed on
Sep 26, 1995
Sold by
Jacobs Christopher Grant
Bought by
Jacobs Christopher
Home Financials for this Owner
Home Financials are based on the most recent Mortgage that was taken out on this home.
Original Mortgage
$60,000
Interest Rate
7.97%
Purchase Details
Closed on
Sep 11, 1995
Sold by
Jacobs Carla
Bought by
Jacobs Christopher
Home Financials for this Owner
Home Financials are based on the most recent Mortgage that was taken out on this home.
Original Mortgage
$60,000
Interest Rate
7.97%
Create a Home Valuation Report for This Property
The Home Valuation Report is an in-depth analysis detailing your home's value as well as a comparison with similar homes in the area
Home Values in the Area
Average Home Value in this Area
Purchase History
| Date | Buyer | Sale Price | Title Company |
|---|---|---|---|
| Rosa Linda | -- | North American Title Co | |
| Rosa James | $145,000 | South Coast Title Company | |
| Jacobs Christopher | -- | First American Title Co | |
| Jacobs Christopher | -- | -- |
Source: Public Records
Mortgage History
| Date | Status | Borrower | Loan Amount |
|---|---|---|---|
| Open | Rosa Linda | $200,000 | |
| Closed | Rosa James | $147,900 | |
| Previous Owner | Jacobs Christopher | $60,000 |
Source: Public Records
Tax History Compared to Growth
Tax History
| Year | Tax Paid | Tax Assessment Tax Assessment Total Assessment is a certain percentage of the fair market value that is determined by local assessors to be the total taxable value of land and additions on the property. | Land | Improvement |
|---|---|---|---|---|
| 2025 | $2,896 | $240,847 | $133,809 | $107,038 |
| 2024 | $2,896 | $236,126 | $131,186 | $104,940 |
| 2023 | $2,839 | $231,497 | $128,614 | $102,883 |
| 2022 | $2,762 | $226,959 | $126,093 | $100,866 |
| 2021 | $2,741 | $222,510 | $123,621 | $98,889 |
| 2020 | $2,708 | $220,230 | $122,354 | $97,876 |
| 2019 | $2,659 | $215,912 | $119,955 | $95,957 |
| 2018 | $2,485 | $211,679 | $117,603 | $94,076 |
| 2017 | $2,424 | $207,530 | $115,298 | $92,232 |
| 2016 | $2,383 | $203,462 | $113,038 | $90,424 |
| 2015 | $2,347 | $200,407 | $111,341 | $89,066 |
| 2014 | $2,302 | $196,482 | $109,160 | $87,322 |
Source: Public Records
Map
Nearby Homes
- 8767 Blue Lake Dr
- 6232 Lake Athabaska Place
- 6354 Arms Lake Ave
- 6056 Winfield Ave
- 6285 Anvil Lake Ave
- 363 Garden Grove Ln
- 6252 Lake Albano Ave
- 6071 Amarillo Ave
- 8671 Lake Murray Blvd Unit 4
- 6387 Anvil Lake Ave
- 6388 Anvil Lake Ave
- 8649 Lake Murray Blvd Unit 4
- 5654 Amaya Dr Unit 150
- 8721 Lake Murray Blvd Unit 1
- 8715 Lake Murray Blvd Unit 4
- 8765 Lake Murray Blvd Unit 3
- 8765 Lake Murray Blvd Unit 11
- 282 Garfield Ave
- 8364 Lake Ashwood Ave
- 8767 Navajo Rd Unit 12
- 6239 S Lake Ct
- 6227 S Lake Ct
- 6245 S Lake Ct
- 6221 S Lake Ct
- 6246 E Lake Dr
- 6234 S Lake Ct Unit 104, 105, 106, 107
- 6234 S Lake Ct
- 6252 E Lake Dr
- 6251 S Lake Ct
- 6215 S Lake Ct
- 6234 S Lake Ct
- 6228 S Lake Ct
- 6240 S Lake Ct
- 6222 S Lake Ct
- 6246 S Lake Ct
- 6257 S Lake Ct
- 6209 S Lake Ct
- 6216 S Lake Ct
- 6252 S Lake Ct Unit 1
- 8796 Blue Lake Dr