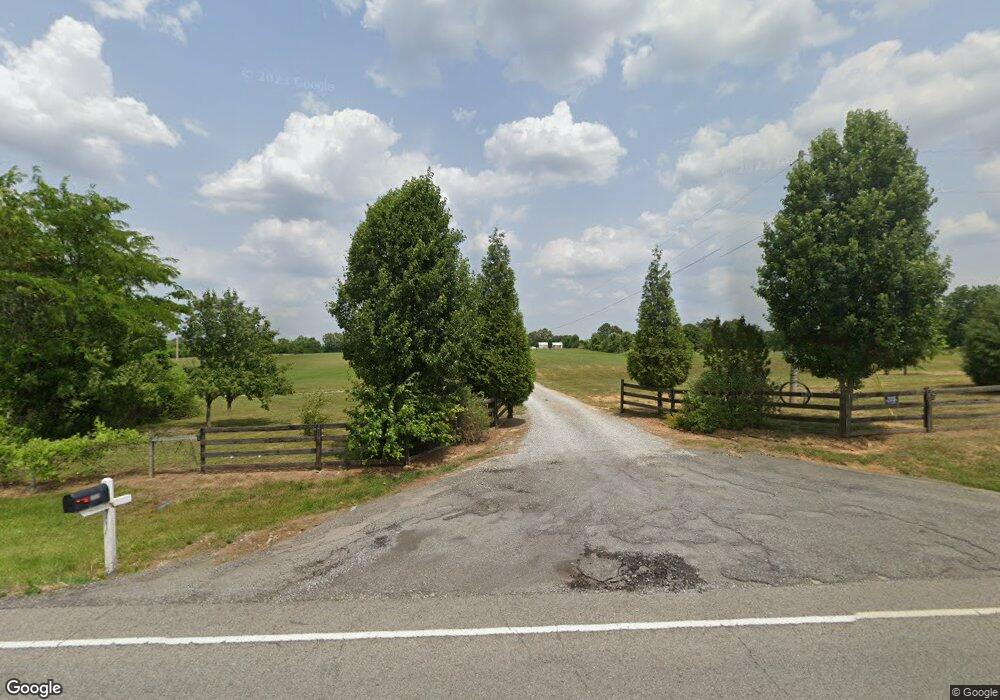
6235 Highway 431 N Springfield, TN 37172
Estimated Value: $443,000 - $653,000
--
Bed
2
Baths
1,840
Sq Ft
$298/Sq Ft
Est. Value
About This Home
This home is located at 6235 Highway 431 N, Springfield, TN 37172 and is currently estimated at $547,776, approximately $297 per square foot. 6235 Highway 431 N is a home located in Robertson County with nearby schools including Krisle Elementary School, Innovation Academy, and Springfield High School.
Ownership History
Date
Name
Owned For
Owner Type
Purchase Details
Closed on
Jun 4, 2025
Sold by
Leding Properties Llc
Bought by
Leding Wayne and Leding Judith
Current Estimated Value
Purchase Details
Closed on
May 10, 2018
Sold by
Baker Judy Ann and Barrera David
Bought by
Leding Properties Llc
Purchase Details
Closed on
Dec 1, 2010
Bought by
Branch Banking And Trust Company
Purchase Details
Closed on
Sep 18, 2007
Sold by
Seeley Kristy L
Bought by
Seeley Dan W
Home Financials for this Owner
Home Financials are based on the most recent Mortgage that was taken out on this home.
Original Mortgage
$231,500
Interest Rate
6.57%
Purchase Details
Closed on
Feb 12, 1999
Sold by
Borthick Dan S and Borthick Evaline S
Bought by
Borthick Dan S
Purchase Details
Closed on
Dec 3, 1998
Sold by
Borthick Dan S and Borthick Evaline S
Bought by
Borthick Dan S and Borthick Evaline S
Purchase Details
Closed on
Oct 31, 1995
Bought by
Triple J Properties
Create a Home Valuation Report for This Property
The Home Valuation Report is an in-depth analysis detailing your home's value as well as a comparison with similar homes in the area
Home Values in the Area
Average Home Value in this Area
Purchase History
| Date | Buyer | Sale Price | Title Company |
|---|---|---|---|
| Leding Wayne | -- | None Listed On Document | |
| Leding Properties Llc | $248,000 | None Available | |
| Branch Banking And Trust Company | $161,000 | -- | |
| Seeley Dan W | -- | -- | |
| Borthick Dan S | -- | -- | |
| Borthick Dan S | -- | -- | |
| Triple J Properties | $78,600 | -- |
Source: Public Records
Mortgage History
| Date | Status | Borrower | Loan Amount |
|---|---|---|---|
| Previous Owner | Triple J Properties | $231,500 |
Source: Public Records
Tax History Compared to Growth
Tax History
| Year | Tax Paid | Tax Assessment Tax Assessment Total Assessment is a certain percentage of the fair market value that is determined by local assessors to be the total taxable value of land and additions on the property. | Land | Improvement |
|---|---|---|---|---|
| 2025 | $1,410 | $78,350 | $0 | $0 |
| 2024 | $1,410 | $78,350 | $19,875 | $58,475 |
| 2023 | $1,410 | $78,350 | $19,875 | $58,475 |
| 2022 | $1,527 | $59,275 | $11,500 | $47,775 |
| 2021 | $1,527 | $59,275 | $11,500 | $47,775 |
| 2020 | $1,527 | $59,275 | $11,500 | $47,775 |
| 2019 | $1,527 | $59,275 | $11,500 | $47,775 |
| 2018 | $1,527 | $91,600 | $43,825 | $47,775 |
| 2017 | $1,708 | $55,375 | $9,400 | $45,975 |
| 2016 | $1,708 | $55,375 | $9,400 | $45,975 |
| 2015 | $1,639 | $55,375 | $9,400 | $45,975 |
| 2014 | $1,639 | $55,375 | $9,400 | $45,975 |
Source: Public Records
Map
Nearby Homes
- 5345 Ashburn Rd
- 6538 Highway 431 N
- 5558 Borthick Rd
- 5561 Borthick Rd
- 5638 Borthick Rd
- 5544 Borthick Rd
- 5570 Borthick Rd
- 5654 Borthick Rd
- 5867 Borthick Rd
- 5257 Fred Perry Rd
- 4785 Pulliam Hardaway Rd
- 509 S High St
- 509 S High St
- 305 W Gallatin St
- 233 E Gallatin St
- 4591 Benson Rd
- 320 N High St
- 112 Burr Aly
- 130 Fugate Ave
- 131 Smith Ave
- 6229 Highway 431 N
- 6229 Highway 431 N
- 5329 Ashburn Rd
- 6241 Highway 431 N
- 6240 Highway 431 N
- 5425 Ashburn Rd
- 6234 Highway 431 N
- 6230 Highway 431 N
- 6224 Highway 431 N
- 6224 Highway 431n
- 6317 Highway 431 N
- 5365 Ashburn Rd
- 5337 Ashburn Rd
- 5403 Ashburn Rd
- 5433 Ashburn Rd
- 5453 Ashburn Rd
- 5395 Ashburn Rd
- 5379 Ashburn Rd
- 5359 Ashburn Rd
- 5371 Ashburn Rd