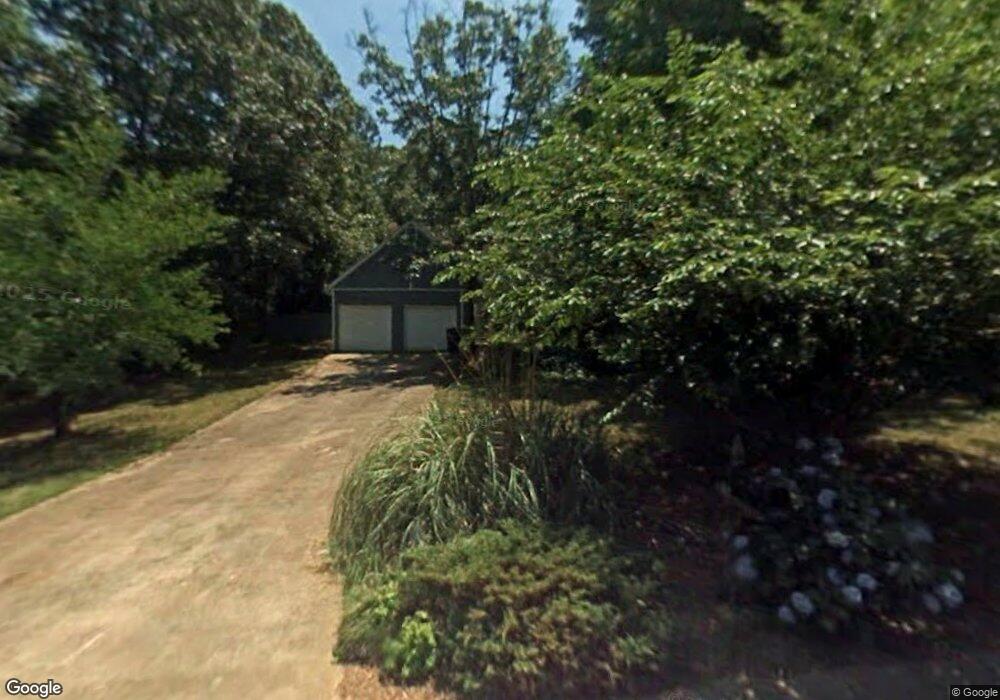
6239 Westridge Trace Acworth, GA 30102
Oak Grove NeighborhoodEstimated Value: $357,402 - $358,000
3
Beds
2
Baths
1,928
Sq Ft
$186/Sq Ft
Est. Value
About This Home
This home is located at 6239 Westridge Trace, Acworth, GA 30102 and is currently estimated at $357,701, approximately $185 per square foot. 6239 Westridge Trace is a home located in Cherokee County with nearby schools including Oak Grove Elementary School, E. T. Booth Middle School, and Etowah High School.
Ownership History
Date
Name
Owned For
Owner Type
Purchase Details
Closed on
Mar 19, 2024
Sold by
Richey Brenda K
Bought by
Richey Brenda K Trust and Brenda K Richey Revocable Living Trust
Current Estimated Value
Purchase Details
Closed on
Aug 30, 2005
Sold by
Pinion Martin
Bought by
Richey Brenda K
Home Financials for this Owner
Home Financials are based on the most recent Mortgage that was taken out on this home.
Original Mortgage
$60,900
Interest Rate
5.66%
Mortgage Type
New Conventional
Purchase Details
Closed on
Mar 24, 2005
Sold by
Secretary Of Hud
Bought by
Pinion Martin
Purchase Details
Closed on
Sep 7, 2004
Sold by
Citimortgage Inc
Bought by
Hud
Purchase Details
Closed on
Sep 26, 2002
Sold by
Smith Donald H
Bought by
Bykoski Rebecca J
Home Financials for this Owner
Home Financials are based on the most recent Mortgage that was taken out on this home.
Original Mortgage
$131,600
Interest Rate
6.07%
Mortgage Type
FHA
Create a Home Valuation Report for This Property
The Home Valuation Report is an in-depth analysis detailing your home's value as well as a comparison with similar homes in the area
Home Values in the Area
Average Home Value in this Area
Purchase History
| Date | Buyer | Sale Price | Title Company |
|---|---|---|---|
| Richey Brenda K Trust | -- | -- | |
| Richey Brenda K | $144,900 | -- | |
| Pinion Martin | -- | -- | |
| Hud | -- | -- | |
| Citimortgage Inc | $138,489 | -- | |
| Bykoski Rebecca J | $132,800 | -- |
Source: Public Records
Mortgage History
| Date | Status | Borrower | Loan Amount |
|---|---|---|---|
| Previous Owner | Richey Brenda K | $60,900 | |
| Previous Owner | Bykoski Rebecca J | $131,600 |
Source: Public Records
Tax History Compared to Growth
Tax History
| Year | Tax Paid | Tax Assessment Tax Assessment Total Assessment is a certain percentage of the fair market value that is determined by local assessors to be the total taxable value of land and additions on the property. | Land | Improvement |
|---|---|---|---|---|
| 2025 | $622 | $139,448 | $30,000 | $109,448 |
| 2024 | $600 | $122,568 | $24,000 | $98,568 |
| 2023 | $478 | $128,248 | $24,000 | $104,248 |
| 2022 | $566 | $102,528 | $20,000 | $82,528 |
| 2021 | $551 | $85,328 | $14,000 | $71,328 |
| 2020 | $514 | $74,848 | $14,000 | $60,848 |
| 2019 | $492 | $69,000 | $14,000 | $55,000 |
| 2018 | $465 | $59,520 | $12,800 | $46,720 |
| 2017 | $463 | $140,400 | $12,800 | $43,360 |
| 2016 | $461 | $129,700 | $11,600 | $40,280 |
| 2015 | $1,395 | $124,400 | $10,000 | $39,760 |
| 2014 | $1,290 | $115,200 | $10,000 | $36,080 |
Source: Public Records
Map
Nearby Homes
- 6226 Westridge Trace
- 6222 Westridge Trace
- 6147 Little Ridge Rd
- 6155 Little Ridge Rd
- 6137 Little Ridge Rd
- 206 Cameron Ct
- 536 Rendezvous Rd
- 517 Rendezvous Rd
- 320 Oak Leaf Place
- 503 Rendezvous Rd
- 577 Oakside Place
- 153 Centennial Ridge Dr
- 3286 Elwin Ragsdale Way
- 240 Ridge Mill Dr
- Bolton Plan at Cherokee Township
- Brooks Plan at Cherokee Township
- Bryson Plan at Cherokee Township
- 302 Seth Way
- 313 Maltibie Dr
- 0 Highway 92 Unit 5623819
- 6235 Westridge Trace
- 6241 Westridge Trace
- 105 Westland Ct
- 6251 Westridge Trace
- 103 Westland Ct
- 6233 Westridge Trace
- 6240 Westridge Trace
- 6242 Westridge Trace
- 107 Westland Ct
- 6244 Westridge Trace
- 6253 Westridge Trace
- 104 Westland Ct
- 6248 Westridge Trace
- 101 Westland Ct
- 6250 Westridge Trace
- 6246 Westridge Trace
- 6231 Westridge Trace
- 106 Westland Ct
- 6488 Will Dupree Ln
- 102 Westland Ct