624 3rd St Kenyon, MN 55946
Estimated Value: $187,000 - $212,602
3
Beds
2
Baths
1,500
Sq Ft
$135/Sq Ft
Est. Value
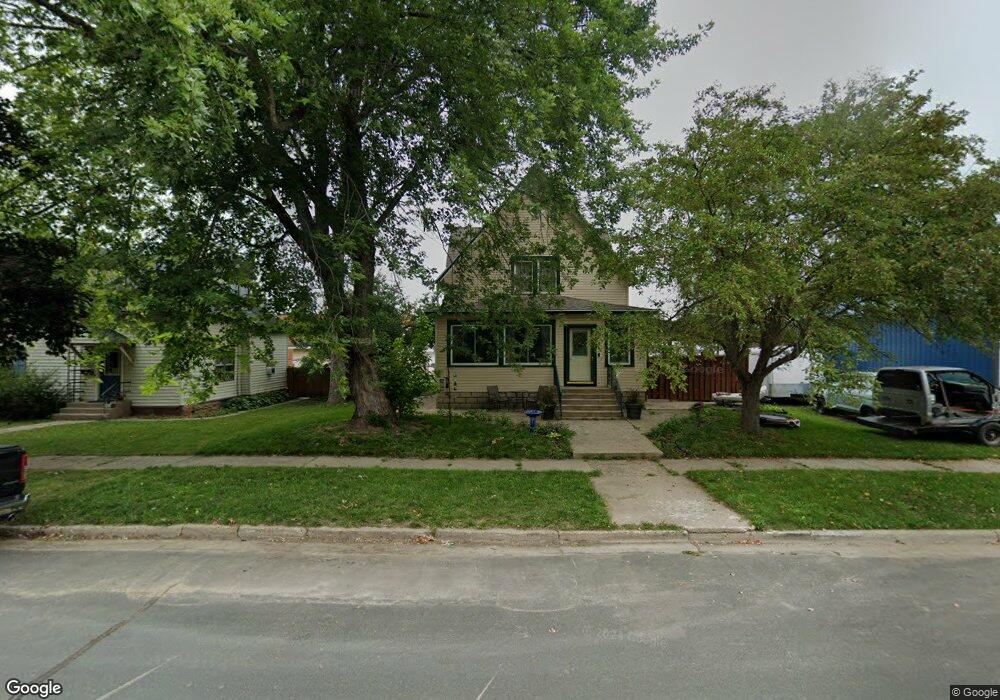
About This Home
This home is located at 624 3rd St, Kenyon, MN 55946 and is currently estimated at $202,901, approximately $135 per square foot. 624 3rd St is a home located in Goodhue County with nearby schools including Kenyon-Wanamingo Elementary School, Kenyon-Wanamingo Middle School, and Kenyon-Wanamingo Senior High School.
Ownership History
Date
Name
Owned For
Owner Type
Purchase Details
Closed on
Feb 8, 2018
Sold by
Fnma
Bought by
Hofland Donna
Current Estimated Value
Purchase Details
Closed on
Dec 27, 2016
Sold by
Ditech Financial Llc
Bought by
Federal National Mortgage Association
Purchase Details
Closed on
Dec 14, 2016
Sold by
Mers Inc
Bought by
Ditech Financial Llc and Green Tree Servicing Llc
Purchase Details
Closed on
Oct 21, 2006
Sold by
Jp Morgan Chase Bank Na
Bought by
Smoody Matthew and Smoody Jennifer
Purchase Details
Closed on
Jul 1, 2003
Sold by
Reynolds Randy and Reynolds Mary K
Bought by
Bias Phillip A and Bias Patsy A
Purchase Details
Closed on
Feb 15, 2000
Sold by
Reynolds Randy W and Reynolds Mary K
Bought by
Bias Phillip and Bias Patsy Ann
Purchase Details
Closed on
Feb 11, 2000
Sold by
Boden James E and Boden Peggy J
Bought by
Reynolds Randy and Reynolds Mary
Create a Home Valuation Report for This Property
The Home Valuation Report is an in-depth analysis detailing your home's value as well as a comparison with similar homes in the area
Purchase History
| Date | Buyer | Sale Price | Title Company |
|---|---|---|---|
| Hofland Donna | -- | -- | |
| Federal National Mortgage Association | -- | None Available | |
| Ditech Financial Llc | -- | None Available | |
| Smoody Matthew | $119,000 | -- | |
| Bias Phillip A | $92,924 | -- | |
| Bias Phillip | $92,925 | -- | |
| Reynolds Randy | $88,500 | -- |
Source: Public Records
Mortgage History
| Date | Status | Borrower | Loan Amount |
|---|---|---|---|
| Closed | Bias Phillip | -- |
Source: Public Records
Tax History
| Year | Tax Paid | Tax Assessment Tax Assessment Total Assessment is a certain percentage of the fair market value that is determined by local assessors to be the total taxable value of land and additions on the property. | Land | Improvement |
|---|---|---|---|---|
| 2025 | -- | $193,800 | $34,500 | $159,300 |
| 2024 | -- | $189,200 | $34,500 | $154,700 |
| 2023 | $2,830 | $175,900 | $34,500 | $141,400 |
| 2022 | $2,574 | $173,400 | $34,500 | $138,900 |
| 2021 | $2,348 | $139,500 | $31,500 | $108,000 |
| 2020 | $2,182 | $136,200 | $31,500 | $104,700 |
| 2019 | $1,792 | $136,800 | $31,500 | $105,300 |
| 2018 | $1,704 | $108,600 | $21,000 | $87,600 |
| 2017 | $1,568 | $105,200 | $21,000 | $84,200 |
| 2016 | $1,400 | $98,700 | $21,000 | $77,700 |
| 2015 | $1,382 | $89,400 | $21,000 | $68,400 |
| 2014 | -- | $86,300 | $18,000 | $68,300 |
Source: Public Records
Map
Nearby Homes
- 412 3rd St
- 103 Bullis St
- 411 Bullis St
- 213 6th St
- 705 State St
- 413 Fawn Run
- 416 Buckshot Ct
- 207 Whitetail Ln
- 206 Whitetail Ln
- 450 Engel Dr
- 550 Engel Dr
- 451 Engel Dr
- -XXX 20th Ave
- 47155 Monkey Valley Hollow
- 44241 70th Ave
- 420 Kielmeyer Ave NE
- 10055 460th St
- 124 Ellington St
- 300 Arnold St
- TBD Minnesota 57
Your Personal Tour Guide
Ask me questions while you tour the home.