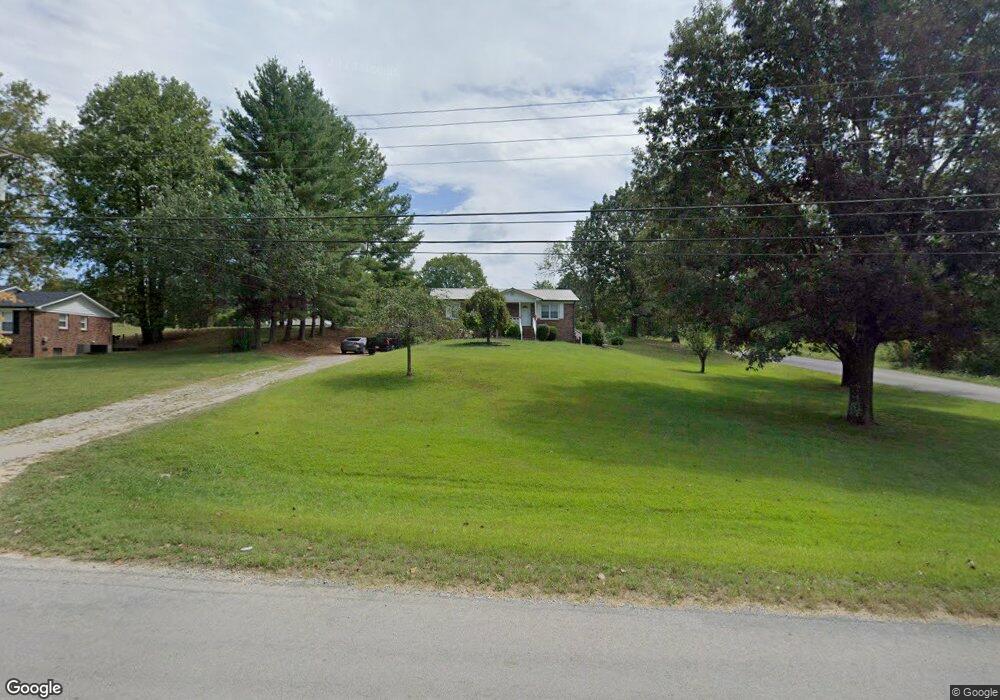
624 C O Hillis Rd Rock Island, TN 38581
Estimated Value: $159,333 - $249,000
--
Bed
1
Bath
984
Sq Ft
$204/Sq Ft
Est. Value
About This Home
This home is located at 624 C O Hillis Rd, Rock Island, TN 38581 and is currently estimated at $200,833, approximately $204 per square foot. 624 C O Hillis Rd is a home located in Warren County with nearby schools including Eastside Elementary School and Warren County High School.
Ownership History
Date
Name
Owned For
Owner Type
Purchase Details
Closed on
Jul 19, 2013
Sold by
Locke Mark Allen
Bought by
Locke Mark Allen and Locke Mitzi Gail
Current Estimated Value
Purchase Details
Closed on
Jul 28, 2009
Sold by
Tammy Renea Locke
Bought by
Locke Mark A
Home Financials for this Owner
Home Financials are based on the most recent Mortgage that was taken out on this home.
Original Mortgage
$27,555
Interest Rate
5.26%
Purchase Details
Closed on
May 27, 2004
Sold by
Cordell Amy
Bought by
Locke Mark
Purchase Details
Closed on
Apr 2, 2001
Sold by
Union Planters Bank
Bought by
Locke Mark A and Locke Tammy R
Purchase Details
Closed on
Mar 16, 2001
Sold by
Locke Tammy R
Bought by
Locke Mark A
Purchase Details
Closed on
Jun 28, 1990
Bought by
Locke Mark A and Tammy Renea
Purchase Details
Closed on
Apr 28, 1984
Bought by
Hash Hash J and Hash Jennie
Create a Home Valuation Report for This Property
The Home Valuation Report is an in-depth analysis detailing your home's value as well as a comparison with similar homes in the area
Home Values in the Area
Average Home Value in this Area
Purchase History
| Date | Buyer | Sale Price | Title Company |
|---|---|---|---|
| Locke Mark Allen | -- | -- | |
| Locke Mark Allen | -- | -- | |
| Locke Mark A | -- | -- | |
| Locke Mark | -- | -- | |
| Locke Mark A | -- | -- | |
| Locke Mark A | -- | -- | |
| Locke Mark A | $4,000 | -- | |
| Hash Hash J | -- | -- |
Source: Public Records
Mortgage History
| Date | Status | Borrower | Loan Amount |
|---|---|---|---|
| Previous Owner | Hash Hash J | $27,555 |
Source: Public Records
Tax History Compared to Growth
Tax History
| Year | Tax Paid | Tax Assessment Tax Assessment Total Assessment is a certain percentage of the fair market value that is determined by local assessors to be the total taxable value of land and additions on the property. | Land | Improvement |
|---|---|---|---|---|
| 2025 | $485 | $42,550 | $0 | $0 |
| 2024 | $485 | $24,650 | $2,500 | $22,150 |
| 2023 | $485 | $24,650 | $2,500 | $22,150 |
| 2022 | $485 | $24,650 | $2,500 | $22,150 |
| 2021 | $485 | $24,650 | $2,500 | $22,150 |
| 2020 | $400 | $24,650 | $2,500 | $22,150 |
| 2019 | $457 | $20,325 | $2,300 | $18,025 |
| 2018 | $400 | $20,325 | $2,300 | $18,025 |
| 2017 | $400 | $20,325 | $2,300 | $18,025 |
| 2016 | $400 | $20,325 | $2,300 | $18,025 |
| 2015 | $406 | $20,325 | $2,300 | $18,025 |
| 2014 | $402 | $20,325 | $2,300 | $18,025 |
| 2013 | $402 | $20,170 | $0 | $0 |
Source: Public Records
Map
Nearby Homes
- 622 Bone Cave Rd
- 0 Bone Cave Rd Unit RTC3048650
- 0 Bone Cave Rd Unit 1518019
- 617 Post Office Rd
- 633 Post Office Rd
- 658 Moore Rd
- 4042 Rocky Ridge Rd
- 1.50 AC Rock Island Shores Dr
- Lot 38 Ranchside Ct
- 0 Rock Island Shores Ln
- 115 Long Point Dr
- 0 Hidden River Rd Unit RTC3050277
- 0 Hidden River Rd Unit RTC3059423
- 0 Hidden River Rd Unit 1315458
- 0 Hidden River Rd Unit RTC3050284
- 0 Hidden River Rd Unit RTC3050288
- 0 Hidden River Rd Unit RTC3052009
- 0 Hidden River Rd Unit RTC2882849
- 0 Hidden River Rd Unit RTC3042823
- 0 Hidden River Rd Unit RTC3033998
- 644 C O Hillis Rd
- 85 Bone Cave Rd
- . Rock Island Shores
- 0 C O Hillis Rd
- 106 Bone Cave Rd
- 7 Rock Island Rd
- 143 Bone Cave Rd
- 27 Rock Island Rd
- 567 C O Hillis Rd
- 17 Crooked Bridge Rd
- 562 C O Hillis Rd
- 0 Bone Cave Rd Unit 209167
- 0 Bone Cave Rd Unit 208665
- 0 Bone Cave Rd Unit RTC2584197
- 0 Bone Cave Rd Unit RTC2157562
- 0 Bone Cave Rd Unit RTC2187358
- 0 Bone Cave Rd Unit RTC2247331
- 0 Bone Cave Rd Unit RTC2360432
- 0 Bone Cave Rd Unit RTC2312366
- 0 Bone Cave Rd