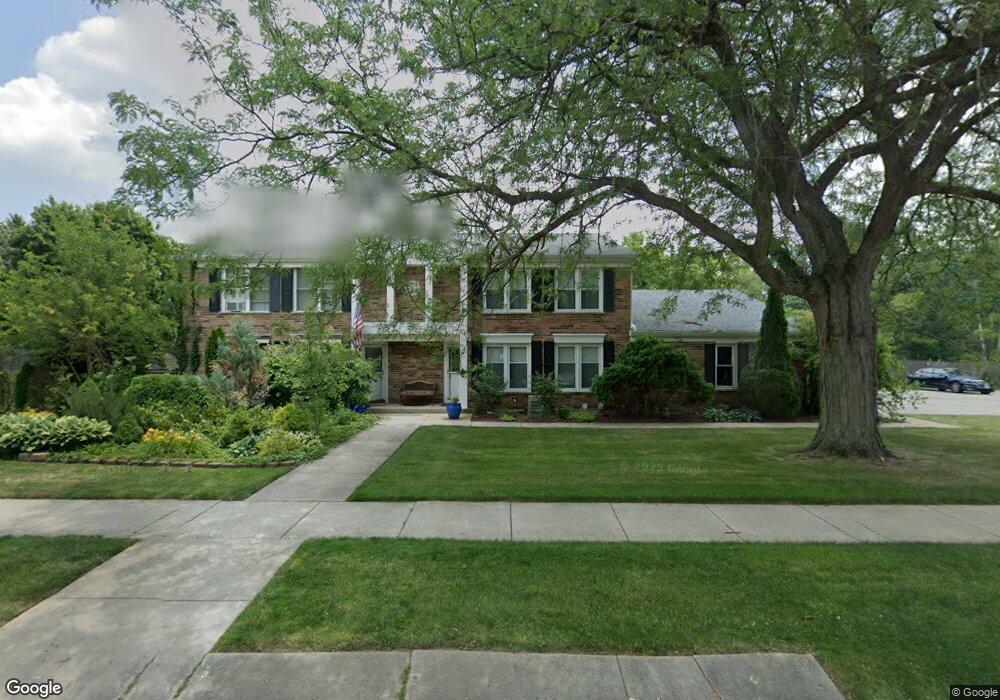
624 S Charles Ave Unit C Naperville, IL 60540
Pembrooke Greens NeighborhoodEstimated Value: $261,990 - $1,030,000
Studio
1
Bath
1,040
Sq Ft
$514/Sq Ft
Est. Value
About This Home
This home is located at 624 S Charles Ave Unit C, Naperville, IL 60540 and is currently estimated at $534,998, approximately $514 per square foot. 624 S Charles Ave Unit C is a home located in DuPage County with nearby schools including Prairie Elementary School, Washington Jr High School, and Naperville North High School.
Ownership History
Date
Name
Owned For
Owner Type
Purchase Details
Closed on
Jan 22, 1999
Sold by
Brooks Cheri M and Gilson Cheri M
Bought by
Neelen Stacy M
Current Estimated Value
Home Financials for this Owner
Home Financials are based on the most recent Mortgage that was taken out on this home.
Original Mortgage
$107,635
Outstanding Balance
$24,944
Interest Rate
6.75%
Mortgage Type
Purchase Money Mortgage
Estimated Equity
$510,054
Create a Home Valuation Report for This Property
The Home Valuation Report is an in-depth analysis detailing your home's value as well as a comparison with similar homes in the area
Home Values in the Area
Average Home Value in this Area
Purchase History
| Date | Buyer | Sale Price | Title Company |
|---|---|---|---|
| Neelen Stacy M | $113,500 | Collar Counties Title Plant |
Source: Public Records
Mortgage History
| Date | Status | Borrower | Loan Amount |
|---|---|---|---|
| Open | Neelen Stacy M | $107,635 |
Source: Public Records
Tax History
| Year | Tax Paid | Tax Assessment Tax Assessment Total Assessment is a certain percentage of the fair market value that is determined by local assessors to be the total taxable value of land and additions on the property. | Land | Improvement |
|---|---|---|---|---|
| 2024 | $3,904 | $71,735 | $8,546 | $63,189 |
| 2023 | $3,734 | $65,470 | $7,800 | $57,670 |
| 2022 | $3,464 | $59,520 | $7,090 | $52,430 |
| 2021 | $3,328 | $57,270 | $6,820 | $50,450 |
| 2020 | $3,253 | $56,240 | $6,700 | $49,540 |
| 2019 | $3,147 | $53,810 | $6,410 | $47,400 |
| 2018 | $2,826 | $48,920 | $5,830 | $43,090 |
| 2017 | $2,760 | $47,270 | $5,630 | $41,640 |
| 2016 | $2,695 | $45,560 | $5,430 | $40,130 |
| 2015 | $2,660 | $42,900 | $5,110 | $37,790 |
| 2014 | $2,632 | $41,360 | $4,930 | $36,430 |
| 2013 | $2,593 | $41,460 | $4,940 | $36,520 |
Source: Public Records
Map
Nearby Homes
- 923 Tim Tam Cir
- 820 Prairie Ave
- 907 Secretariat Dr
- 479 S Julian St
- 908 Julian Ct
- 488 S Columbia St
- 616 Driftwood Ct
- 1105 Johnson Dr
- 221 Olesen Dr
- 706 S Loomis St Unit D
- 932 E Chicago Ave
- 226 S Columbia St
- 915 E Chicago Ave
- 1386 Old Dominion Ct
- 24 S Huffman St
- 311 Millcreek Ln
- 203 S Columbia St
- 1172 Kenilworth Cir
- 328 S Loomis St
- 707 Thornwood Dr
- 624 S Charles Ave Unit A
- 624 S Charles Ave Unit B
- 624 S Charles Ave Unit D
- 650 S Charles Ave
- 613 Balmoral Cir
- 26W021 Parkside Rd
- 605 S Charles Ave Unit 3
- 605 Balmoral Cir
- 609 Balmoral Cir
- 608 S Charles Ave
- 646 S Charles Ave
- 2 Parkside Rd
- 622 Balmoral Cir
- 1005 Whirlaway Ave
- 618 Balmoral Cir
- 604 Count Fleet Ct
- 612 S Charles Ave
- 639 Balmoral Cir
- 614 Balmoral Cir
- 7S270 S Charles Ave
Your Personal Tour Guide
Ask me questions while you tour the home.