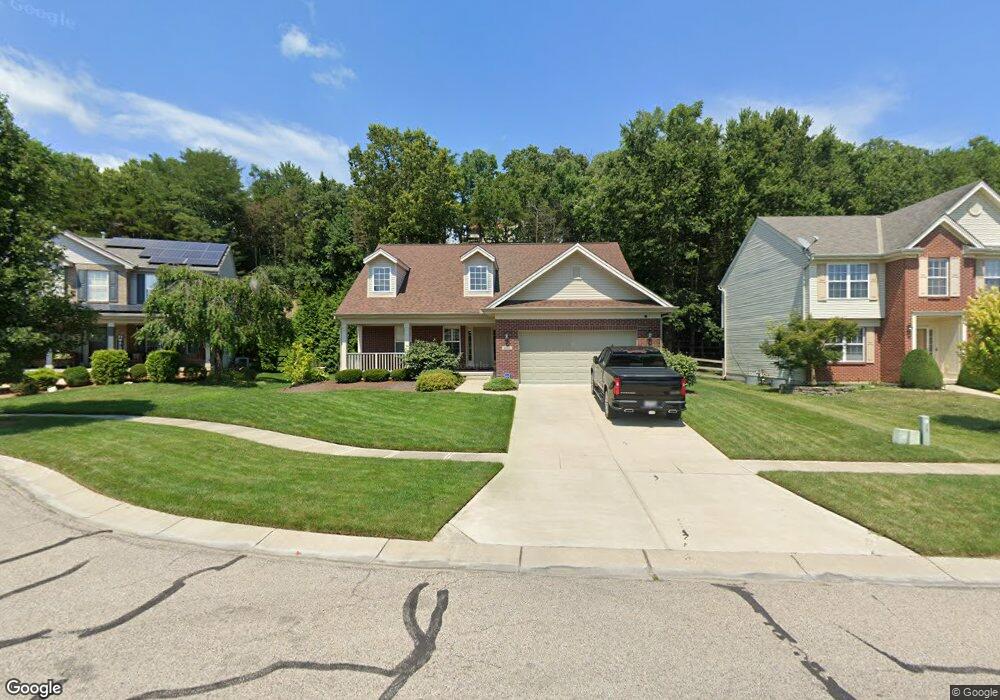
624 Wood Bluff Ln Harrison, OH 45030
Estimated Value: $407,000 - $441,000
3
Beds
3
Baths
2,534
Sq Ft
$165/Sq Ft
Est. Value
About This Home
This home is located at 624 Wood Bluff Ln, Harrison, OH 45030 and is currently estimated at $418,588, approximately $165 per square foot. 624 Wood Bluff Ln is a home located in Hamilton County with nearby schools including William Henry Harrison High School, St. John The Baptist School, and Summit Academy of Southwest Ohio.
Ownership History
Date
Name
Owned For
Owner Type
Purchase Details
Closed on
Sep 25, 2009
Sold by
Jack H Wieland Builders Inc
Bought by
Isaacs Cynthia K and Zoellner Lloyd R
Current Estimated Value
Purchase Details
Closed on
Feb 24, 2006
Sold by
Jack H Wieland Builders Inc
Bought by
Isaacs Cynthia K and Zoellner Lloyd R
Home Financials for this Owner
Home Financials are based on the most recent Mortgage that was taken out on this home.
Original Mortgage
$240,400
Interest Rate
6.22%
Mortgage Type
Fannie Mae Freddie Mac
Purchase Details
Closed on
Jan 10, 2006
Sold by
West Stone Ridge Group Llc
Bought by
Jack H Wieland Builders Inc
Home Financials for this Owner
Home Financials are based on the most recent Mortgage that was taken out on this home.
Original Mortgage
$240,400
Interest Rate
6.22%
Mortgage Type
Fannie Mae Freddie Mac
Create a Home Valuation Report for This Property
The Home Valuation Report is an in-depth analysis detailing your home's value as well as a comparison with similar homes in the area
Home Values in the Area
Average Home Value in this Area
Purchase History
| Date | Buyer | Sale Price | Title Company |
|---|---|---|---|
| Isaacs Cynthia K | -- | Attorney | |
| Isaacs Cynthia K | $253,200 | First Title Inc | |
| Jack H Wieland Builders Inc | -- | None Available |
Source: Public Records
Mortgage History
| Date | Status | Borrower | Loan Amount |
|---|---|---|---|
| Previous Owner | Isaacs Cynthia K | $240,400 | |
| Previous Owner | Jack H Wieland Builders Inc | $5,000,000 |
Source: Public Records
Tax History
| Year | Tax Paid | Tax Assessment Tax Assessment Total Assessment is a certain percentage of the fair market value that is determined by local assessors to be the total taxable value of land and additions on the property. | Land | Improvement |
|---|---|---|---|---|
| 2025 | $5,955 | $133,298 | $13,650 | $119,648 |
| 2023 | $5,973 | $133,298 | $13,650 | $119,648 |
| 2022 | $4,730 | $92,404 | $13,965 | $78,439 |
| 2021 | $4,676 | $92,404 | $13,965 | $78,439 |
| 2020 | $4,731 | $92,404 | $13,965 | $78,439 |
| 2019 | $4,339 | $81,057 | $12,250 | $68,807 |
| 2018 | $4,363 | $81,057 | $12,250 | $68,807 |
| 2017 | $4,115 | $81,057 | $12,250 | $68,807 |
| 2016 | $3,893 | $83,006 | $12,005 | $71,001 |
| 2015 | $3,940 | $83,006 | $12,005 | $71,001 |
| 2014 | $3,755 | $83,006 | $12,005 | $71,001 |
| 2013 | $3,859 | $84,700 | $12,250 | $72,450 |
Source: Public Records
Map
Nearby Homes
- 10803 Stone Ridge Way Unit 15
- 10740 Stone Ridge Way
- 398 Legacy Way
- 449 Lyness Ave
- 10701 Campbell Rd
- 125 Hopping Ct
- 207 Biddle Ave
- 143 Flintstone Dr
- 120 Westfield Dr
- 117 Westfield Dr
- 130 Country View Dr
- 305 Whitewater Dr
- 300 Whitewater Dr
- 135 Turner Ridge Dr
- 155 Turner Ridge Dr
- 157 Turner Ridge Dr
- 163 Turner Ridge Dr
- 0 West Rd Unit 1867316
- 0 Carolina Trace Rd Unit 1840792
- 214 S Walnut St
- 622 Wood Bluff Ln
- 626 Wood Bluff Ln
- 625 Valley Trails Dr
- 623 Valley Trails Dr
- 627 Valley Trails Dr
- 10771 Stone Ridge Way
- 10766 Stone Ridge Way
- 621 Valley Trails Dr
- 10769 Stone Ridge Way
- 629 Valley Trails Dr
- 618 Wood Bluff Ln
- 10767 Stone Ridge Way
- 619 Valley Trails Dr
- 631 Valley Trails Dr
- 10762 Stone Ridge Way
- 616 Wood Bluff Ln
- 621 Wood Bluff Ln
- 10765 Stone Ridge Way
- 617 Valley Trails Dr
- 619 Wood Bluff Ln
Your Personal Tour Guide
Ask me questions while you tour the home.