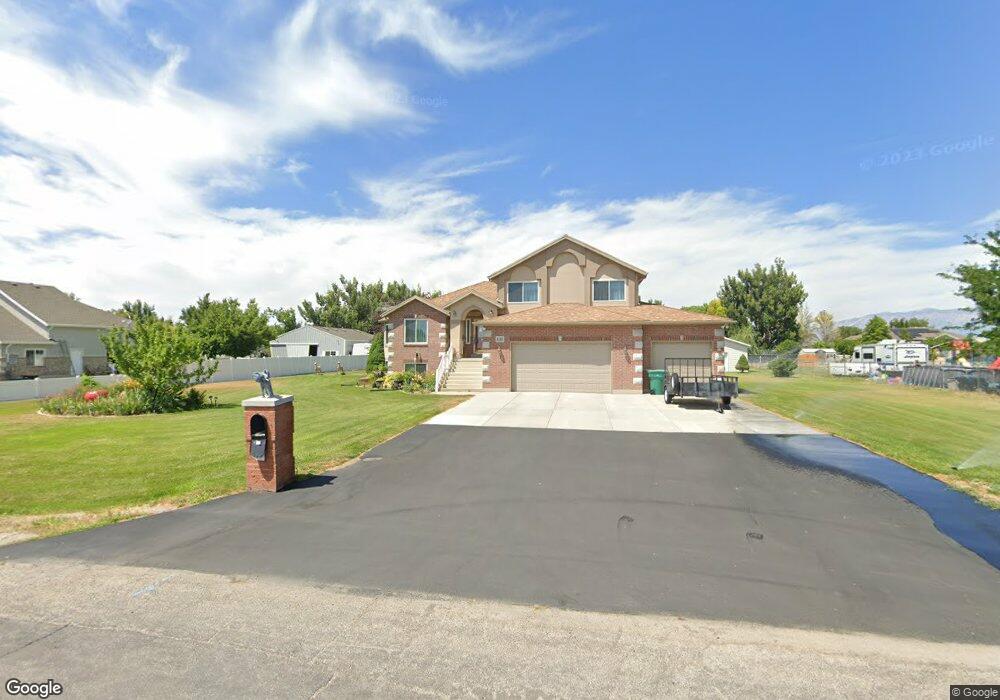
6240 W 4800 S Hooper, UT 84315
Estimated Value: $775,000 - $839,000
4
Beds
4
Baths
3,522
Sq Ft
$228/Sq Ft
Est. Value
About This Home
This home is located at 6240 W 4800 S, Hooper, UT 84315 and is currently estimated at $801,377, approximately $227 per square foot. 6240 W 4800 S is a home located in Weber County with nearby schools including Hooper Elementary School, Rocky Mountain Junior High School, and Quest Academy.
Ownership History
Date
Name
Owned For
Owner Type
Purchase Details
Closed on
May 25, 2011
Sold by
Weaver Gary A and Weaver Bonita K
Bought by
Weaver Family Trust
Current Estimated Value
Purchase Details
Closed on
Apr 7, 2009
Sold by
The Weaver Family Trust
Bought by
Weaver Gary A and Weaver Bonita K
Purchase Details
Closed on
Aug 3, 2005
Sold by
Weaver Gary A and Weaver Bonita K
Bought by
Weaver Gary Alan and Weaver Bonita Kay
Home Financials for this Owner
Home Financials are based on the most recent Mortgage that was taken out on this home.
Original Mortgage
$188,000
Interest Rate
5.65%
Mortgage Type
Fannie Mae Freddie Mac
Purchase Details
Closed on
Jun 28, 2005
Sold by
Tindle Gloria
Bought by
Weaver Gary A and Weaver Bonita K
Home Financials for this Owner
Home Financials are based on the most recent Mortgage that was taken out on this home.
Original Mortgage
$188,000
Interest Rate
5.65%
Mortgage Type
Fannie Mae Freddie Mac
Purchase Details
Closed on
Dec 21, 2004
Sold by
Tindle Ronald Emmett
Bought by
Tindle Ronald Emmett and Tindle Gloria
Purchase Details
Closed on
Jun 7, 2002
Sold by
Farr Miland R and Farr Mary
Bought by
Tindle Ronald Emmett
Home Financials for this Owner
Home Financials are based on the most recent Mortgage that was taken out on this home.
Original Mortgage
$228,000
Interest Rate
6.83%
Purchase Details
Closed on
Mar 26, 2001
Sold by
Farr Miland R
Bought by
Farr Miland R and Farr Mary
Home Financials for this Owner
Home Financials are based on the most recent Mortgage that was taken out on this home.
Original Mortgage
$156,500
Interest Rate
7.19%
Purchase Details
Closed on
Nov 9, 1999
Sold by
Farr Miland R and Farr Mary E
Bought by
Farr Miland R
Home Financials for this Owner
Home Financials are based on the most recent Mortgage that was taken out on this home.
Original Mortgage
$148,000
Interest Rate
7.68%
Purchase Details
Closed on
Nov 2, 1999
Sold by
Thomas S Lowe Subdivision Inc
Bought by
Farr Miland R and Farr Mary E
Home Financials for this Owner
Home Financials are based on the most recent Mortgage that was taken out on this home.
Original Mortgage
$148,000
Interest Rate
7.68%
Create a Home Valuation Report for This Property
The Home Valuation Report is an in-depth analysis detailing your home's value as well as a comparison with similar homes in the area
Home Values in the Area
Average Home Value in this Area
Purchase History
| Date | Buyer | Sale Price | Title Company |
|---|---|---|---|
| Weaver Family Trust | -- | None Available | |
| Weaver Gary A | -- | None Available | |
| Weaver Gary Alan | -- | -- | |
| Weaver Gary A | -- | -- | |
| Tindle Ronald Emmett | -- | -- | |
| Tindle Ronald Emmett | -- | -- | |
| Farr Miland R | -- | Pinnacle Title Ins Agency In | |
| Farr Miland R | -- | Associated Title | |
| Farr Miland R | -- | Cardon Land Title |
Source: Public Records
Mortgage History
| Date | Status | Borrower | Loan Amount |
|---|---|---|---|
| Previous Owner | Weaver Gary A | $188,000 | |
| Previous Owner | Tindle Ronald Emmett | $228,000 | |
| Previous Owner | Farr Miland R | $156,500 | |
| Previous Owner | Farr Miland R | $148,000 |
Source: Public Records
Tax History
| Year | Tax Paid | Tax Assessment Tax Assessment Total Assessment is a certain percentage of the fair market value that is determined by local assessors to be the total taxable value of land and additions on the property. | Land | Improvement |
|---|---|---|---|---|
| 2025 | $4,540 | $791,762 | $216,230 | $575,532 |
| 2024 | $4,364 | $426,248 | $118,926 | $307,322 |
| 2023 | $4,518 | $437,251 | $119,083 | $318,168 |
| 2022 | $4,628 | $458,150 | $103,062 | $355,088 |
| 2021 | $3,632 | $606,000 | $94,803 | $511,197 |
| 2020 | $3,703 | $566,000 | $75,881 | $490,119 |
| 2019 | $3,535 | $550,000 | $72,226 | $477,774 |
| 2018 | $3,415 | $514,000 | $72,226 | $441,774 |
| 2017 | $3,070 | $443,000 | $58,526 | $384,474 |
| 2016 | $2,931 | $211,836 | $32,323 | $179,513 |
| 2015 | $2,854 | $203,288 | $32,323 | $170,965 |
| 2014 | $2,631 | $182,292 | $32,323 | $149,969 |
Source: Public Records
Map
Nearby Homes
- 6036 W 4700 S
- 3729 S 5600 W Unit 6
- 3720 S 5600 W Unit 2
- 3732 S 5600 W Unit 3
- 3719 S 5600 W Unit 7
- 4129 S 5800 W Unit 4
- 4146 S 5800 W Unit 5
- 4194 S 5800 W Unit 14
- 4168 S 5800 W Unit 12
- 4179 S 5800 W Unit 1
- 4163 S 5800 W Unit 2
- 0 W 5500 S
- 5577 W 4000 S
- 3842 S 5675 W
- 4111 S 5350 W
- 5335 W 5500 S
- 3706 S 5650 W Unit 9
- 4836 S 5050 W
- 3191 S 5100 St W Unit 1
- 3691 S 5600 W Unit 20