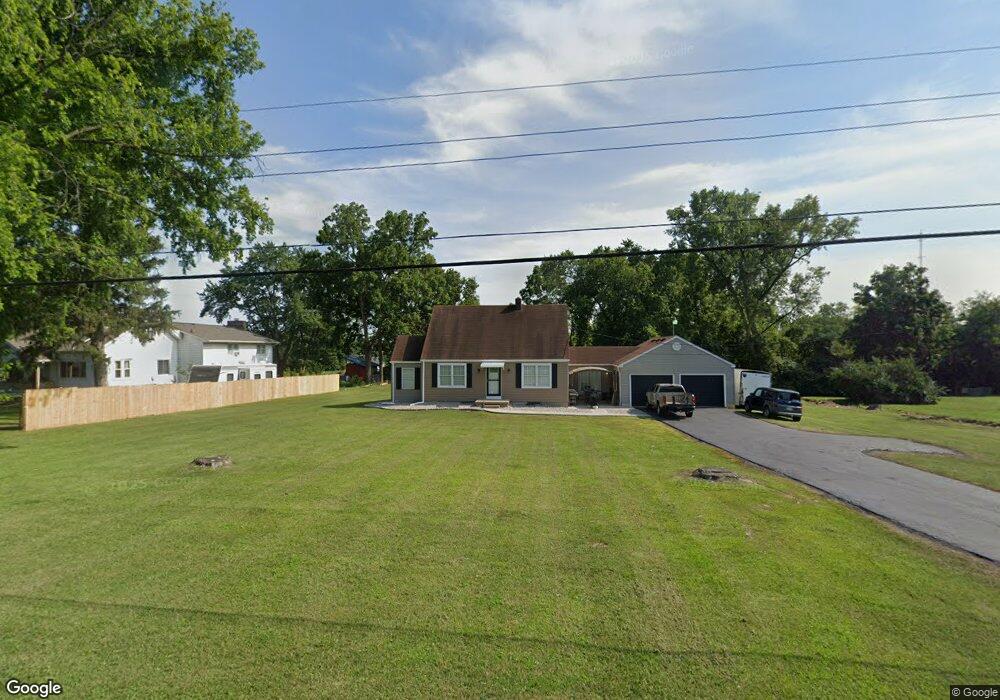
6243 Manchester Rd Franklin, OH 45005
Estimated Value: $228,000 - $261,000
3
Beds
1
Bath
1,760
Sq Ft
$138/Sq Ft
Est. Value
About This Home
This home is located at 6243 Manchester Rd, Franklin, OH 45005 and is currently estimated at $242,149, approximately $137 per square foot. 6243 Manchester Rd is a home located in Warren County with nearby schools including Franklin High School, Summit Academy Community School for Alternative Learners - Middletown, and Summit Academy Secondary School - Middletown.
Ownership History
Date
Name
Owned For
Owner Type
Purchase Details
Closed on
Sep 24, 2021
Sold by
Banks Daniel S and Banks Tamatha A
Bought by
Banks Eric and Banks Kimberly
Current Estimated Value
Home Financials for this Owner
Home Financials are based on the most recent Mortgage that was taken out on this home.
Original Mortgage
$162,011
Outstanding Balance
$146,127
Interest Rate
2.8%
Mortgage Type
FHA
Estimated Equity
$96,022
Purchase Details
Closed on
Jun 15, 2005
Sold by
Tuggle William G and Tuggle Ruth V
Bought by
Banks Daniel S and Banks Tamatha A
Home Financials for this Owner
Home Financials are based on the most recent Mortgage that was taken out on this home.
Original Mortgage
$96,000
Interest Rate
5.87%
Mortgage Type
Fannie Mae Freddie Mac
Create a Home Valuation Report for This Property
The Home Valuation Report is an in-depth analysis detailing your home's value as well as a comparison with similar homes in the area
Home Values in the Area
Average Home Value in this Area
Purchase History
| Date | Buyer | Sale Price | Title Company |
|---|---|---|---|
| Banks Eric | $165,000 | American Homeland Title | |
| Banks Daniel S | $120,000 | Mid America Land Title |
Source: Public Records
Mortgage History
| Date | Status | Borrower | Loan Amount |
|---|---|---|---|
| Open | Banks Eric | $162,011 | |
| Previous Owner | Banks Daniel S | $96,000 |
Source: Public Records
Tax History
| Year | Tax Paid | Tax Assessment Tax Assessment Total Assessment is a certain percentage of the fair market value that is determined by local assessors to be the total taxable value of land and additions on the property. | Land | Improvement |
|---|---|---|---|---|
| 2025 | $2,831 | $64,230 | $16,690 | $47,540 |
| 2024 | $2,831 | $64,230 | $16,690 | $47,540 |
| 2023 | $2,563 | $52,353 | $10,262 | $42,091 |
| 2022 | $2,506 | $52,353 | $10,262 | $42,091 |
| 2021 | $2,366 | $52,353 | $10,262 | $42,091 |
| 2020 | $2,187 | $42,564 | $8,344 | $34,220 |
| 2019 | $1,975 | $42,564 | $8,344 | $34,220 |
| 2018 | $1,968 | $42,564 | $8,344 | $34,220 |
| 2017 | $1,839 | $36,001 | $6,895 | $29,106 |
| 2016 | $1,878 | $36,001 | $6,895 | $29,106 |
| 2015 | $1,879 | $36,001 | $6,895 | $29,106 |
| 2014 | $1,934 | $36,000 | $6,900 | $29,110 |
| 2013 | $1,634 | $43,560 | $8,340 | $35,220 |
Source: Public Records
Map
Nearby Homes
- 5757 S Dixie Hwy
- 5845 Manchester Rd
- 5696 Woodcreek Dr
- 6759 Manchester Rd
- 5744 Lynn St
- 6777 Crystal Harbour Dr
- 5667 Woodcreek Dr
- 5865 Hayden Dr
- 5925 Millbrook Dr
- 6633 Rivulet Dr
- 6645 Rivulet Dr
- 6006 Tributary Park
- 5760 Autumn Dr
- 6334 Bevis Ln
- 25 Timber Creek Dr
- 65 Timber Creek Dr
- 100 Pleasant Hill Blvd
- 5019 Waterford Dr
- 5013 Waterford Ln
- Creekside Luxury Ranch Villa Plan at Waterford Place
- 6223 Manchester Rd
- 6285 Manchester Rd
- 6232 Manchester Rd
- 6278 Manchester Rd
- 6187 Manchester Rd
- 6331 Manchester Rd
- 6149 Manchester Rd
- 6150 Manchester Rd
- 6206 Manchester Rd
- 6169 Manchester Rd
- 6304 Manchester Rd
- 6373 Manchester Rd
- 6338 Manchester Rd
- 9 Manchester Rd Unit 9
- 2 Manchester Rd Unit 2
- 6403 Manchester Rd
- 5334 Tewert Rd
- 5376 Ford Ln
- 5334 Tewert Rd
- 5428 Ford Ln
Your Personal Tour Guide
Ask me questions while you tour the home.