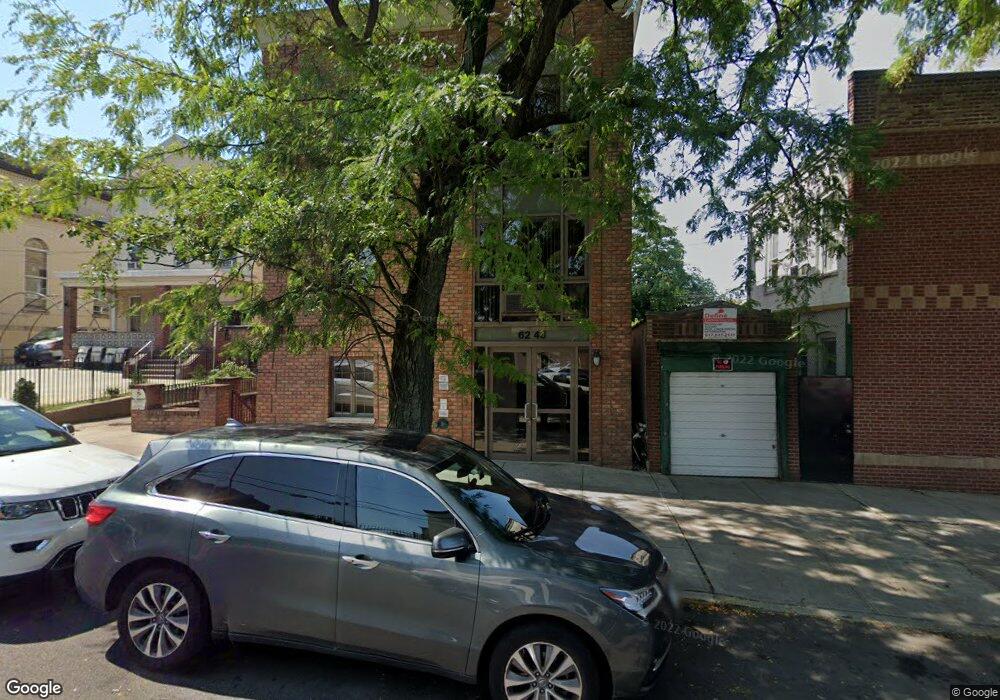
6248 60th Place Unit 1B Flushing, NY 11385
Ridgewood NeighborhoodEstimated Value: $396,000 - $466,000
--
Bed
--
Bath
498
Sq Ft
$880/Sq Ft
Est. Value
About This Home
This home is located at 6248 60th Place Unit 1B, Flushing, NY 11385 and is currently estimated at $438,009, approximately $879 per square foot. 6248 60th Place Unit 1B is a home located in Queens County with nearby schools including P.S. 71 Forest, I.S. 093 Ridgewood, and Grover Cleveland High School.
Ownership History
Date
Name
Owned For
Owner Type
Purchase Details
Closed on
Jun 24, 2021
Sold by
Gerard Cardinale As Executor
Bought by
Reino Maila
Current Estimated Value
Home Financials for this Owner
Home Financials are based on the most recent Mortgage that was taken out on this home.
Original Mortgage
$363,750
Outstanding Balance
$329,330
Interest Rate
2.9%
Mortgage Type
Purchase Money Mortgage
Estimated Equity
$108,679
Purchase Details
Closed on
Dec 14, 2018
Sold by
Ciesluk Barbara and Ciesluk Marta
Bought by
Cardinale Thomas
Purchase Details
Closed on
Aug 2, 2011
Sold by
Tma Development Llc
Bought by
Ciesluk Barbara and Ciesluk Marta
Home Financials for this Owner
Home Financials are based on the most recent Mortgage that was taken out on this home.
Original Mortgage
$229,042
Interest Rate
4.62%
Mortgage Type
Purchase Money Mortgage
Create a Home Valuation Report for This Property
The Home Valuation Report is an in-depth analysis detailing your home's value as well as a comparison with similar homes in the area
Home Values in the Area
Average Home Value in this Area
Purchase History
| Date | Buyer | Sale Price | Title Company |
|---|---|---|---|
| Reino Maila | $375,000 | -- | |
| Cardinale Thomas | $400,000 | -- | |
| Ciesluk Barbara | $238,337 | -- |
Source: Public Records
Mortgage History
| Date | Status | Borrower | Loan Amount |
|---|---|---|---|
| Open | Reino Maila | $363,750 | |
| Previous Owner | Ciesluk Barbara | $229,042 |
Source: Public Records
Tax History Compared to Growth
Tax History
| Year | Tax Paid | Tax Assessment Tax Assessment Total Assessment is a certain percentage of the fair market value that is determined by local assessors to be the total taxable value of land and additions on the property. | Land | Improvement |
|---|---|---|---|---|
| 2025 | $2,759 | $23,524 | $1,930 | $21,594 |
| 2024 | $2,759 | $22,192 | $2,011 | $20,181 |
| 2023 | $1,809 | $20,936 | $2,086 | $18,850 |
| 2022 | $957 | $24,044 | $2,570 | $21,474 |
| 2021 | $222 | $23,015 | $2,570 | $20,445 |
| 2020 | $223 | $21,824 | $2,570 | $19,254 |
| 2019 | $220 | $18,974 | $2,570 | $16,404 |
| 2018 | $215 | $17,447 | $2,301 | $15,146 |
| 2017 | $215 | $16,460 | $2,216 | $14,244 |
| 2016 | $210 | $16,460 | $2,216 | $14,244 |
| 2015 | $96 | $16,336 | $2,055 | $14,281 |
| 2014 | $96 | $15,412 | $2,327 | $13,085 |
Source: Public Records
Map
Nearby Homes
- 62-60 60th St
- 6018 Bleecker St
- 5803 Metropolitan Ave
- 5631 Metropolitan Ave
- 2247 Harman St
- 6315 Forest Ave Unit 1A
- 60-14 Menahan St
- 63-16 Forest Ave Unit 1B
- 6167 56th St
- 61-25 Menahan St
- 2135 Menahan St
- 63-34 Fresh Pond Rd Unit 3G
- 6334 Fresh Pond Rd Unit 4G
- 6334 Fresh Pond Rd Unit 2G
- 5932 Grove St
- 60-68 60th Rd
- 6161 62nd Ave
- 5929 Linden St
- 6143 55th St
- 60-23 60th Rd
- 62-48 60th Place Unit 1C
- 62-48 60th Place Unit 3 D
- 6248 60th Place Unit 1 G
- 62-48 60th Place Unit 2D
- 62-48 60th Place Unit 3C
- 62-48 60th Place Unit 2A
- 6248 60th Place Unit P-2
- 6248 60th Place Unit 2C
- 6248 60th Place Unit 2B
- 6248 60th Place Unit P-6
- 6248 60th Place Unit P-1
- 6248 60th Place Unit 3D
- 6248 60th Place Unit P-3
- 6248 60th Place Unit P-7
- 6248 60th Place Unit P-5
- 6248 60th Place Unit P-4
- 6248 60th Place Unit 3B
- 6248 60th Place Unit 2A
- 6248 60th Place Unit 1C
- 6248 60th Place