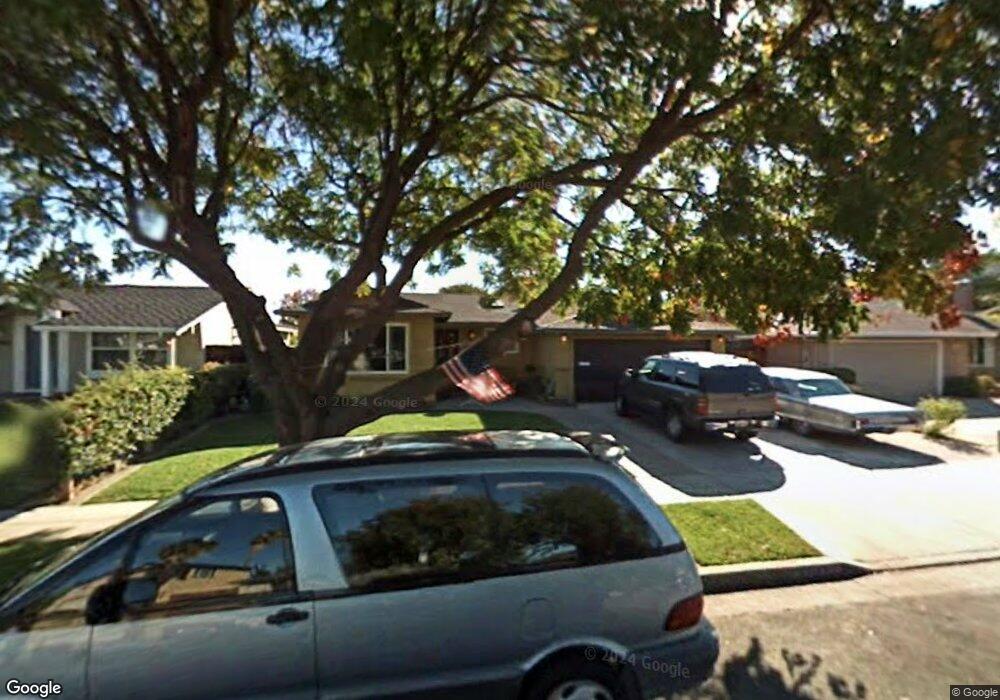
6248 Sager Way San Jose, CA 95123
Santa Teresa Foothills NeighborhoodEstimated Value: $1,440,000 - $1,612,000
4
Beds
2
Baths
1,495
Sq Ft
$1,035/Sq Ft
Est. Value
About This Home
This home is located at 6248 Sager Way, San Jose, CA 95123 and is currently estimated at $1,546,732, approximately $1,034 per square foot. 6248 Sager Way is a home located in Santa Clara County with nearby schools including Sakamoto Elementary School, Herman (Leonard) Intermediate School, and Santa Teresa High School.
Ownership History
Date
Name
Owned For
Owner Type
Purchase Details
Closed on
Nov 9, 2001
Sold by
Rodriguez Alfredo and Rodriguez Renee
Bought by
Rodriguez Alfredo and Rodriguez Renee
Current Estimated Value
Home Financials for this Owner
Home Financials are based on the most recent Mortgage that was taken out on this home.
Original Mortgage
$275,000
Outstanding Balance
$106,295
Interest Rate
6.57%
Estimated Equity
$1,440,437
Purchase Details
Closed on
Aug 25, 1998
Sold by
Compise Renee M and Rodriguez Alfredo
Bought by
Rodriguez Alfredo and Compise Renee Marie
Home Financials for this Owner
Home Financials are based on the most recent Mortgage that was taken out on this home.
Original Mortgage
$216,000
Interest Rate
6.93%
Purchase Details
Closed on
Jan 18, 1994
Sold by
Lee Jae Hong and Lee Ok Jin
Bought by
Compise Renee Marie and Ledesma Reginald
Home Financials for this Owner
Home Financials are based on the most recent Mortgage that was taken out on this home.
Original Mortgage
$173,700
Interest Rate
7.21%
Create a Home Valuation Report for This Property
The Home Valuation Report is an in-depth analysis detailing your home's value as well as a comparison with similar homes in the area
Home Values in the Area
Average Home Value in this Area
Purchase History
| Date | Buyer | Sale Price | Title Company |
|---|---|---|---|
| Rodriguez Alfredo | -- | Chicago Title | |
| Rodriguez Alfredo | -- | Stewart Title | |
| Compise Renee Marie | $193,000 | American Title Insurance Co |
Source: Public Records
Mortgage History
| Date | Status | Borrower | Loan Amount |
|---|---|---|---|
| Open | Rodriguez Alfredo | $275,000 | |
| Closed | Rodriguez Alfredo | $216,000 | |
| Previous Owner | Compise Renee Marie | $173,700 |
Source: Public Records
Tax History Compared to Growth
Tax History
| Year | Tax Paid | Tax Assessment Tax Assessment Total Assessment is a certain percentage of the fair market value that is determined by local assessors to be the total taxable value of land and additions on the property. | Land | Improvement |
|---|---|---|---|---|
| 2025 | $6,138 | $375,426 | $175,120 | $200,306 |
| 2024 | $6,138 | $368,066 | $171,687 | $196,379 |
| 2023 | $6,012 | $360,850 | $168,321 | $192,529 |
| 2022 | $5,960 | $353,775 | $165,021 | $188,754 |
| 2021 | $5,828 | $346,839 | $161,786 | $185,053 |
| 2020 | $5,671 | $343,284 | $160,128 | $183,156 |
| 2019 | $5,522 | $336,554 | $156,989 | $179,565 |
| 2018 | $5,465 | $329,956 | $153,911 | $176,045 |
| 2017 | $5,386 | $323,488 | $150,894 | $172,594 |
| 2016 | $5,128 | $317,146 | $147,936 | $169,210 |
| 2015 | $5,012 | $312,383 | $145,714 | $166,669 |
| 2014 | $4,379 | $306,265 | $142,860 | $163,405 |
Source: Public Records
Map
Nearby Homes
- 6298 Snell Ave
- 6161 Iowa Dr
- 5834 Santa Teresa Blvd
- 625 Kiowa Cir
- 529 Galen Dr
- 731 Los Huecos Dr
- 737 Los Huecos Dr
- 5967 Shawcroft Dr
- 6239 Mahan Dr
- 482 Calero Ave
- 5991 Sorrel Ave
- 775 Sunset Glen Dr
- 783 Vereda Ct
- 5857 Blossom Ave
- 729 Calero Ave
- 18950 Graystone Ln
- 415 Conestoga Way
- 5841 Blossom Ave
- 497 Curie Dr
- 471 Tovar Dr
- 6244 Sager Way
- 6252 Sager Way
- 6263 Tillamook Dr
- 6267 Tillamook Dr
- 6256 Sager Way
- 6240 Sager Way
- 6259 Tillamook Dr
- 6271 Tillamook Dr
- 6255 Tillamook Dr
- 6247 Sager Way
- 6251 Sager Way
- 6260 Sager Way
- 6236 Sager Way
- 6243 Sager Way
- 6255 Sager Way
- 6275 Tillamook Dr
- 6239 Sager Way
- 6251 Tillamook Dr
- 6259 Sager Way
- 6264 Sager Way