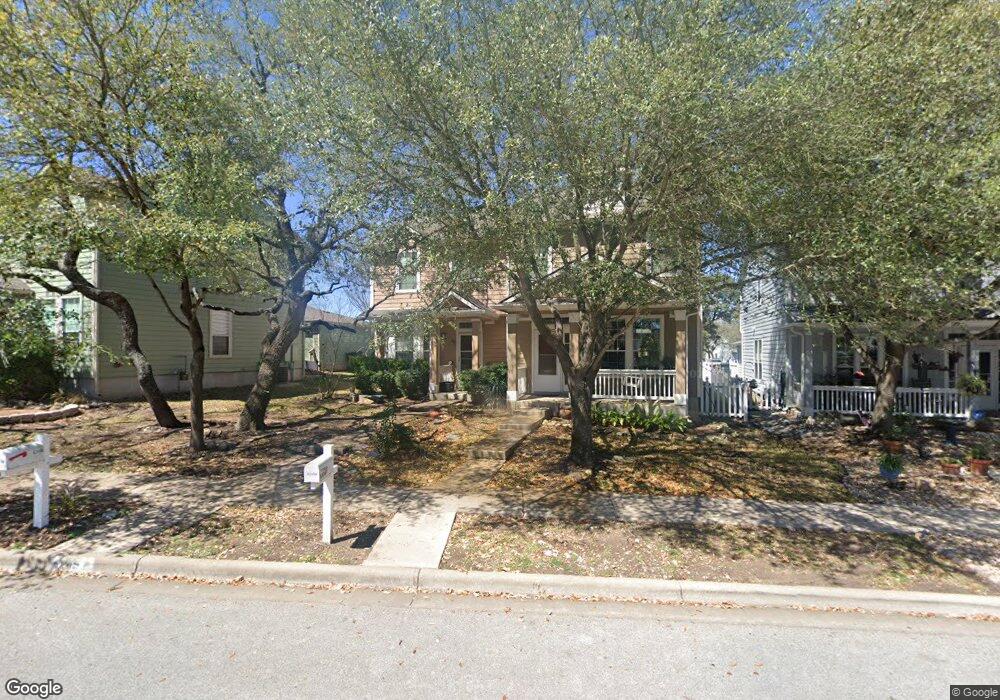
6249 Negley Unit A Kyle, TX 78640
Plum Creek NeighborhoodEstimated Value: $256,946 - $306,000
3
Beds
3
Baths
1,400
Sq Ft
$196/Sq Ft
Est. Value
About This Home
This home is located at 6249 Negley Unit A, Kyle, TX 78640 and is currently estimated at $274,487, approximately $196 per square foot. 6249 Negley Unit A is a home located in Hays County with nearby schools including Laura B Negley Elementary School, R C Barton Middle School, and Jack C Hays High School.
Ownership History
Date
Name
Owned For
Owner Type
Purchase Details
Closed on
May 9, 2008
Sold by
Leblanc Teresa L
Bought by
Willms Deborah L
Current Estimated Value
Home Financials for this Owner
Home Financials are based on the most recent Mortgage that was taken out on this home.
Original Mortgage
$107,200
Outstanding Balance
$67,818
Interest Rate
5.86%
Mortgage Type
Purchase Money Mortgage
Estimated Equity
$206,669
Purchase Details
Closed on
Mar 16, 2007
Sold by
Robinson Toby and Robinson Kellie
Bought by
Leblanc Teresa L
Home Financials for this Owner
Home Financials are based on the most recent Mortgage that was taken out on this home.
Original Mortgage
$127,000
Interest Rate
6.3%
Mortgage Type
Purchase Money Mortgage
Purchase Details
Closed on
Oct 3, 2003
Sold by
Pulte Homes Of Texas Lp
Bought by
Willms Deborah L
Home Financials for this Owner
Home Financials are based on the most recent Mortgage that was taken out on this home.
Original Mortgage
$112,465
Interest Rate
6.25%
Mortgage Type
FHA
Create a Home Valuation Report for This Property
The Home Valuation Report is an in-depth analysis detailing your home's value as well as a comparison with similar homes in the area
Home Values in the Area
Average Home Value in this Area
Purchase History
| Date | Buyer | Sale Price | Title Company |
|---|---|---|---|
| Willms Deborah L | -- | Gracy Title Company | |
| Leblanc Teresa L | -- | Opr Title Agency | |
| Willms Deborah L | -- | -- | |
| Willms Deborah L | -- | -- | |
| Robinson Toby | -- | First American Title Ins Co |
Source: Public Records
Mortgage History
| Date | Status | Borrower | Loan Amount |
|---|---|---|---|
| Open | Willms Deborah L | $107,200 | |
| Previous Owner | Willms Deborah L | $127,000 | |
| Previous Owner | Robinson Toby | $112,465 |
Source: Public Records
Tax History
| Year | Tax Paid | Tax Assessment Tax Assessment Total Assessment is a certain percentage of the fair market value that is determined by local assessors to be the total taxable value of land and additions on the property. | Land | Improvement |
|---|---|---|---|---|
| 2025 | $2,938 | $276,990 | $70,800 | $206,190 |
| 2024 | $60 | $267,710 | $70,800 | $196,910 |
| 2023 | $5,819 | $260,489 | $88,500 | $217,940 |
| 2022 | $5,763 | $236,808 | $75,000 | $227,900 |
| 2021 | $5,712 | $215,280 | $39,200 | $176,080 |
| 2019 | $5,232 | $189,410 | $29,400 | $160,010 |
| 2018 | $5,009 | $180,860 | $21,000 | $159,860 |
| 2017 | $4,760 | $168,839 | $21,000 | $153,380 |
| 2016 | $4,327 | $153,490 | $21,000 | $132,490 |
| 2015 | $3,536 | $146,460 | $21,000 | $125,460 |
Source: Public Records
Map
Nearby Homes
Your Personal Tour Guide
Ask me questions while you tour the home.