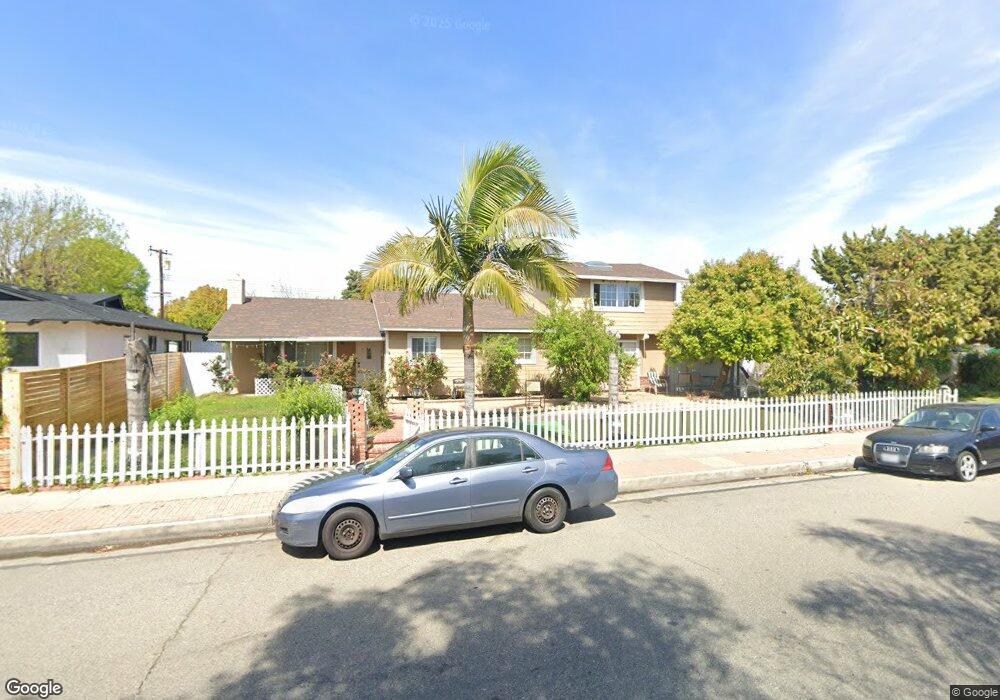
625 E Yorba Linda Blvd Placentia, CA 92870
Estimated Value: $1,014,000 - $1,185,518
3
Beds
2
Baths
1,828
Sq Ft
$592/Sq Ft
Est. Value
About This Home
This home is located at 625 E Yorba Linda Blvd, Placentia, CA 92870 and is currently estimated at $1,082,130, approximately $591 per square foot. 625 E Yorba Linda Blvd is a home located in Orange County with nearby schools including Wagner Elementary School, Col. J. K. Tuffree Middle School, and El Dorado High School.
Ownership History
Date
Name
Owned For
Owner Type
Purchase Details
Closed on
Jul 15, 2005
Sold by
Aung Htoo and Aung Rachel Wai
Bought by
Gonzalez Heraclio and Gonzalez Mariseal
Current Estimated Value
Home Financials for this Owner
Home Financials are based on the most recent Mortgage that was taken out on this home.
Original Mortgage
$448,000
Interest Rate
5.72%
Mortgage Type
Purchase Money Mortgage
Purchase Details
Closed on
Jul 8, 1998
Sold by
H O E Investment Inc
Bought by
Aung Htoo and Aung Rachel Wai
Home Financials for this Owner
Home Financials are based on the most recent Mortgage that was taken out on this home.
Original Mortgage
$166,400
Interest Rate
6.91%
Purchase Details
Closed on
Feb 17, 1998
Sold by
Brock Elvin L and Brock Esther L
Bought by
H O E Investment Inc
Purchase Details
Closed on
Oct 13, 1993
Sold by
Great Western Bank
Bought by
Brock Elvin L and Brock Esther L
Home Financials for this Owner
Home Financials are based on the most recent Mortgage that was taken out on this home.
Original Mortgage
$184,000
Interest Rate
6.88%
Mortgage Type
VA
Create a Home Valuation Report for This Property
The Home Valuation Report is an in-depth analysis detailing your home's value as well as a comparison with similar homes in the area
Home Values in the Area
Average Home Value in this Area
Purchase History
| Date | Buyer | Sale Price | Title Company |
|---|---|---|---|
| Gonzalez Heraclio | $560,000 | First American Title Co | |
| Aung Htoo | $208,000 | Landwood Title Company | |
| H O E Investment Inc | $153,899 | -- | |
| Brock Elvin L | $182,000 | Chicago Title Company |
Source: Public Records
Mortgage History
| Date | Status | Borrower | Loan Amount |
|---|---|---|---|
| Previous Owner | Gonzalez Heraclio | $448,000 | |
| Previous Owner | Aung Htoo | $166,400 | |
| Previous Owner | Brock Elvin L | $184,000 | |
| Closed | Aung Htoo | $20,800 |
Source: Public Records
Tax History Compared to Growth
Tax History
| Year | Tax Paid | Tax Assessment Tax Assessment Total Assessment is a certain percentage of the fair market value that is determined by local assessors to be the total taxable value of land and additions on the property. | Land | Improvement |
|---|---|---|---|---|
| 2025 | $8,753 | $765,279 | $622,333 | $142,946 |
| 2024 | $8,753 | $750,274 | $610,130 | $140,144 |
| 2023 | $8,268 | $706,431 | $580,425 | $126,006 |
| 2022 | $8,157 | $692,580 | $569,044 | $123,536 |
| 2021 | $7,971 | $679,000 | $557,886 | $121,114 |
| 2020 | $8,071 | $679,000 | $557,886 | $121,114 |
| 2019 | $7,896 | $679,000 | $557,886 | $121,114 |
| 2018 | $7,343 | $624,000 | $517,299 | $106,701 |
| 2017 | $6,981 | $590,000 | $483,299 | $106,701 |
| 2016 | $6,966 | $590,000 | $483,299 | $106,701 |
| 2015 | $6,973 | $590,000 | $483,299 | $106,701 |
| 2014 | $5,859 | $493,850 | $387,149 | $106,701 |
Source: Public Records
Map
Nearby Homes
- 619 E Yorba Linda Blvd
- 1701 Shaw Cir
- 421 Larry Ln
- 439 Normandy Ave
- 4882 Kermath St
- 1837 Kelleher Place
- 719 Cobb Ave
- 1713 Roanoke St
- 1295 N Kraemer Blvd Unit 23
- 1926 Winney Cir
- 4571 Mimosa Dr
- 4942 Gem Ln
- 943 Berkenstock Ln
- 16692 Meadowview Dr
- 186 Southampton Way Unit 29
- 1018 Violet Cir
- 921 Azalea Ave
- 213 E Borromeo Ave
- 11715 Rose Dr
- 1429 Prospect Ave Unit B
- 631 E Yorba Linda Blvd
- 624 Peg Place
- 618 Peg Place
- 630 Peg Place
- 625 Heather Ave
- 601 E Yorba Linda Blvd Unit 4
- 601 E Yorba Linda Blvd Unit 10
- 601 E Yorba Linda Blvd Unit 9
- 601 E Yorba Linda Blvd Unit 8
- 601 E Yorba Linda Blvd Unit 7
- 601 E Yorba Linda Blvd Unit 6
- 601 E Yorba Linda Blvd Unit 5
- 601 E Yorba Linda Blvd Unit 4
- 601 E Yorba Linda Blvd
- 601 E Yorba Linda Blvd Unit 2
- 601 E Yorba Linda Blvd Unit 1
- 631 Heather Ave
- 619 Heather Ave
- 613 Peg Place
- 1502 Seville St