Estimated Value: $252,000 - $284,000
4
Beds
2
Baths
1,345
Sq Ft
$201/Sq Ft
Est. Value
About This Home
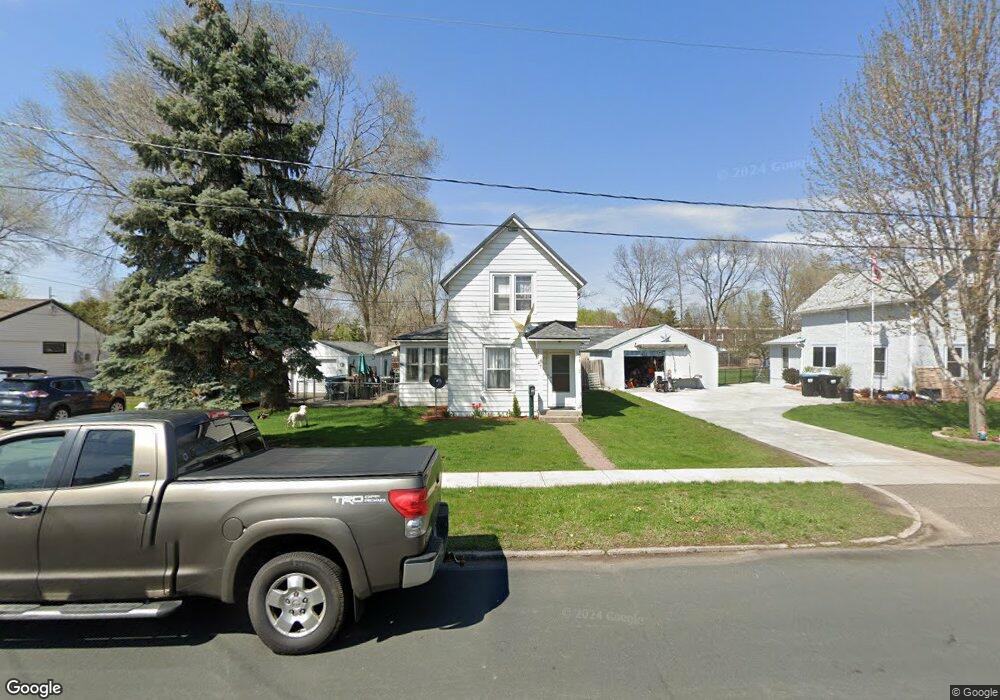
This home is located at 625 Johnson St, Anoka, MN 55303 and is currently estimated at $270,027, approximately $200 per square foot. 625 Johnson St is a home located in Anoka County with nearby schools including Lincoln Elementary School for the Arts, Anoka Middle School for the Arts - Fred Moor Campus, and Anoka Senior High School.
Ownership History
Date
Name
Owned For
Owner Type
Purchase Details
Closed on
Mar 15, 2022
Sold by
Eisenbeis Martha
Bought by
Percy Amanda
Current Estimated Value
Home Financials for this Owner
Home Financials are based on the most recent Mortgage that was taken out on this home.
Original Mortgage
$209,000
Outstanding Balance
$195,273
Interest Rate
3.92%
Mortgage Type
New Conventional
Estimated Equity
$74,754
Purchase Details
Closed on
May 15, 2019
Sold by
Walker Tanayia Lynn and Johnson Tanayla Lynn
Bought by
Eisenbeis Martha N
Home Financials for this Owner
Home Financials are based on the most recent Mortgage that was taken out on this home.
Original Mortgage
$184,300
Interest Rate
4%
Mortgage Type
New Conventional
Purchase Details
Closed on
Apr 28, 2006
Sold by
Guimont Greg D and Guimont Ann
Bought by
Not Provided and Johnson Harold
Create a Home Valuation Report for This Property
The Home Valuation Report is an in-depth analysis detailing your home's value as well as a comparison with similar homes in the area
Home Values in the Area
Average Home Value in this Area
Purchase History
| Date | Buyer | Sale Price | Title Company |
|---|---|---|---|
| Percy Amanda | $211,000 | -- | |
| Eisenbeis Martha N | $190,000 | Edina Realty Title Inc | |
| Not Provided | $191,000 | -- |
Source: Public Records
Mortgage History
| Date | Status | Borrower | Loan Amount |
|---|---|---|---|
| Open | Percy Amanda | $209,000 | |
| Previous Owner | Eisenbeis Martha N | $184,300 |
Source: Public Records
Tax History Compared to Growth
Tax History
| Year | Tax Paid | Tax Assessment Tax Assessment Total Assessment is a certain percentage of the fair market value that is determined by local assessors to be the total taxable value of land and additions on the property. | Land | Improvement |
|---|---|---|---|---|
| 2025 | $3,305 | $216,700 | $70,000 | $146,700 |
| 2024 | $3,305 | $213,600 | $65,000 | $148,600 |
| 2023 | $1,931 | $221,300 | $65,000 | $156,300 |
| 2022 | $1,974 | $217,400 | $52,500 | $164,900 |
| 2021 | $1,990 | $182,400 | $47,300 | $135,100 |
| 2020 | $1,940 | $179,100 | $52,500 | $126,600 |
| 2019 | $1,827 | $167,000 | $45,000 | $122,000 |
| 2018 | $1,757 | $152,800 | $0 | $0 |
| 2017 | $1,522 | $141,300 | $0 | $0 |
| 2016 | $1,531 | $116,700 | $0 | $0 |
| 2015 | $1,440 | $116,700 | $35,000 | $81,700 |
| 2014 | -- | $93,000 | $19,500 | $73,500 |
Source: Public Records
Map
Nearby Homes
- 651 Randall Dr
- 6xx Pierce St
- 2838 9th Ln
- 304 Rum River Way
- 3071 Rum River Way
- 759 Hull Rd
- 426 Taylor St
- 618 Tyler St
- 2801 11th Ave
- 2543 11th Ave
- 721 Harrison St
- 527 Harrison St
- 2553 11th Ave
- 3533 Aldrich Ave
- 948 Norwood Ave
- 608 School St
- 956 Blackoaks Ln
- 13136 Vintage St NW
- 1410 Cleveland St
- 2126 Branch Ave