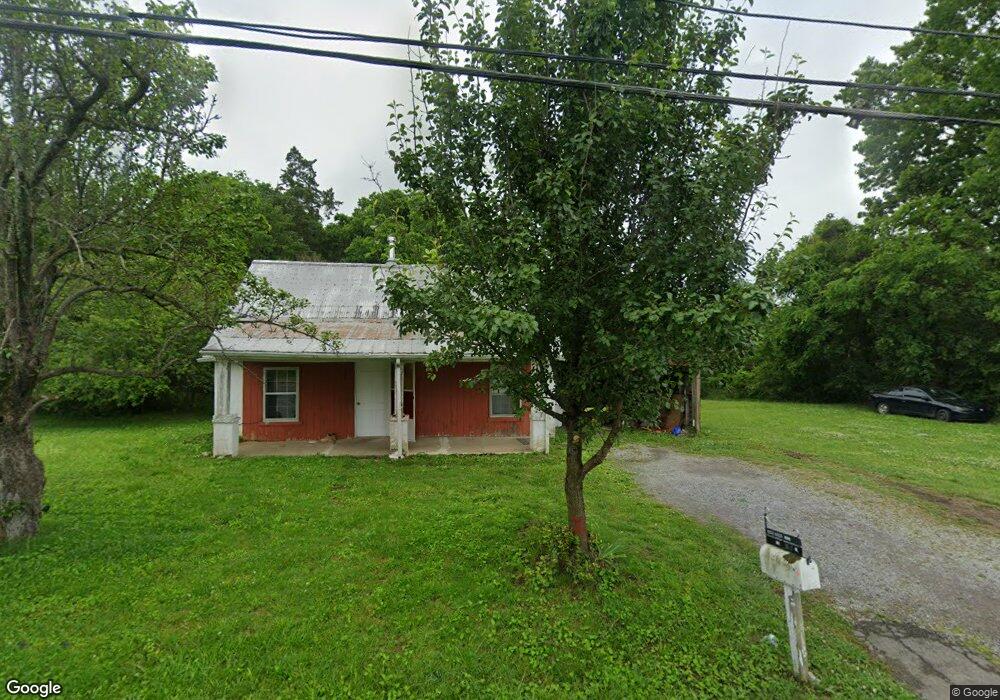
625 Mac St Shelbyville, TN 37160
Estimated Value: $107,773 - $269,000
--
Bed
1
Bath
811
Sq Ft
$213/Sq Ft
Est. Value
About This Home
This home is located at 625 Mac St, Shelbyville, TN 37160 and is currently estimated at $172,591, approximately $212 per square foot. 625 Mac St is a home located in Bedford County with nearby schools including East Side Elementary School, Harris Middle School, and Christian Chapel Academy.
Ownership History
Date
Name
Owned For
Owner Type
Purchase Details
Closed on
Jul 20, 2020
Sold by
Burks William Stanley and Burks Louise
Bought by
Mata Vazquez Lucio
Current Estimated Value
Home Financials for this Owner
Home Financials are based on the most recent Mortgage that was taken out on this home.
Original Mortgage
$28,000
Outstanding Balance
$24,773
Interest Rate
3.1%
Mortgage Type
New Conventional
Estimated Equity
$147,818
Purchase Details
Closed on
Jul 3, 2003
Sold by
Donald Carpenter
Bought by
Burks William and Burks Betty
Home Financials for this Owner
Home Financials are based on the most recent Mortgage that was taken out on this home.
Original Mortgage
$17,000
Interest Rate
5.2%
Purchase Details
Closed on
Dec 11, 1950
Bought by
Carpenter Carpenter W and Carpenter Grace
Purchase Details
Closed on
May 29, 1946
Create a Home Valuation Report for This Property
The Home Valuation Report is an in-depth analysis detailing your home's value as well as a comparison with similar homes in the area
Home Values in the Area
Average Home Value in this Area
Purchase History
| Date | Buyer | Sale Price | Title Company |
|---|---|---|---|
| Mata Vazquez Lucio | $60,000 | None Available | |
| Burks William | $36,000 | -- | |
| Carpenter Carpenter W | -- | -- | |
| -- | -- | -- |
Source: Public Records
Mortgage History
| Date | Status | Borrower | Loan Amount |
|---|---|---|---|
| Open | Mata Vazquez Lucio | $28,000 | |
| Previous Owner | Not Available | $17,000 |
Source: Public Records
Tax History Compared to Growth
Tax History
| Year | Tax Paid | Tax Assessment Tax Assessment Total Assessment is a certain percentage of the fair market value that is determined by local assessors to be the total taxable value of land and additions on the property. | Land | Improvement |
|---|---|---|---|---|
| 2025 | -- | $15,650 | $0 | $0 |
| 2024 | -- | $15,650 | $6,200 | $9,450 |
| 2023 | $596 | $15,650 | $6,200 | $9,450 |
| 2022 | $613 | $15,650 | $6,200 | $9,450 |
| 2021 | $557 | $15,650 | $6,200 | $9,450 |
| 2020 | $444 | $15,650 | $6,200 | $9,450 |
| 2019 | $444 | $10,025 | $3,700 | $6,325 |
| 2018 | $438 | $10,025 | $3,700 | $6,325 |
| 2017 | $438 | $10,125 | $3,700 | $6,425 |
| 2016 | $434 | $10,125 | $3,700 | $6,425 |
| 2015 | $434 | $10,125 | $3,700 | $6,425 |
| 2014 | $350 | $8,937 | $0 | $0 |
Source: Public Records
Map
Nearby Homes
- 402 Rose Ln
- 152 Demonbreum Cir
- 106 Demonbreum Cir
- 329 Dover St
- 107 Demonbreum Cir
- 110 Demonbreum Cir
- 410 Dover St
- 111 Demonbreum Cir
- 112 Demombreum Cir
- 100 Demombreum Cir
- 103 Laurelwood Dr
- 122 Laurelwood Dr
- 109 Demombreum Cir
- 130 Horseshoe Dr
- 108 Demombreum Cir
- 1030 Union St
- 407 Dow Dr
- 223 Megan Cir
- 101 Briar Patch Dr
- 1615 Elevation ABC Plan at Wheatfield