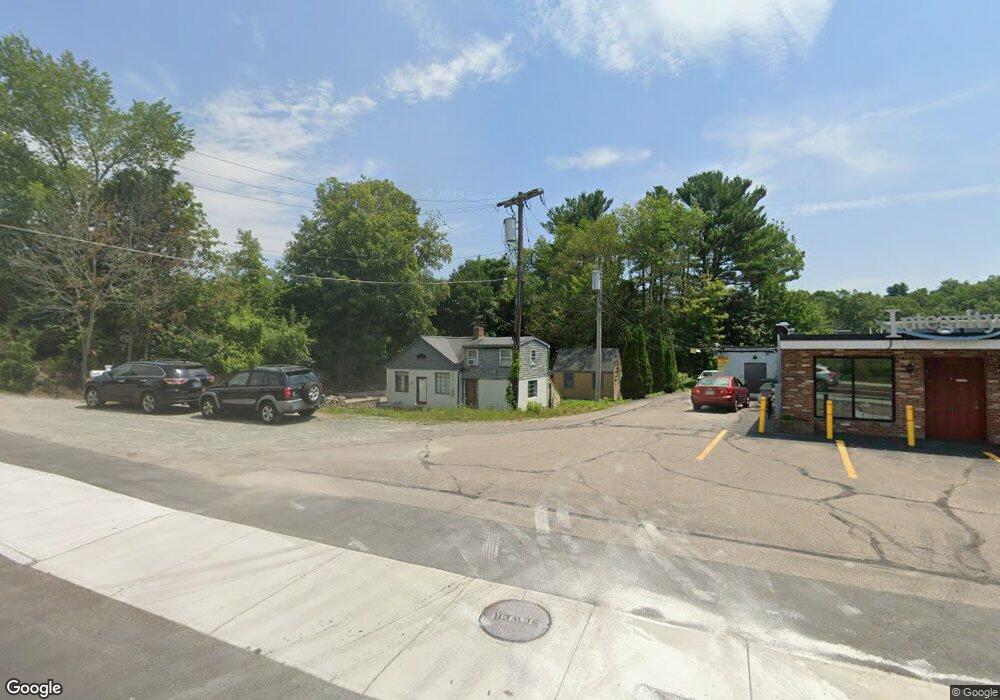
625 Main St Walpole, MA 02081
Estimated Value: $471,849 - $544,000
2
Beds
1
Bath
1,302
Sq Ft
$404/Sq Ft
Est. Value
About This Home
This home is located at 625 Main St, Walpole, MA 02081 and is currently estimated at $525,462, approximately $403 per square foot. 625 Main St is a home located in Norfolk County with nearby schools including Fisher School, Walpole Middle School, and Walpole High School.
Ownership History
Date
Name
Owned For
Owner Type
Purchase Details
Closed on
Oct 10, 2018
Sold by
625 Main Street Rt and Simeone
Bought by
Glaro Marketplace Llc
Current Estimated Value
Home Financials for this Owner
Home Financials are based on the most recent Mortgage that was taken out on this home.
Original Mortgage
$1,575,000
Outstanding Balance
$1,362,111
Interest Rate
4.5%
Mortgage Type
Commercial
Estimated Equity
-$836,649
Purchase Details
Closed on
Apr 8, 2009
Sold by
Fisher Richard W
Bought by
625 Main Street Rt and Simeone
Create a Home Valuation Report for This Property
The Home Valuation Report is an in-depth analysis detailing your home's value as well as a comparison with similar homes in the area
Home Values in the Area
Average Home Value in this Area
Purchase History
| Date | Buyer | Sale Price | Title Company |
|---|---|---|---|
| Glaro Marketplace Llc | $300,000 | -- | |
| 625 Main Street Rt | $250,000 | -- |
Source: Public Records
Mortgage History
| Date | Status | Borrower | Loan Amount |
|---|---|---|---|
| Open | Glaro Marketplace Llc | $1,575,000 |
Source: Public Records
Tax History
| Year | Tax Paid | Tax Assessment Tax Assessment Total Assessment is a certain percentage of the fair market value that is determined by local assessors to be the total taxable value of land and additions on the property. | Land | Improvement |
|---|---|---|---|---|
| 2025 | $4,956 | $386,300 | $273,100 | $113,200 |
| 2024 | $4,846 | $366,600 | $262,600 | $104,000 |
| 2023 | $4,650 | $334,800 | $228,400 | $106,400 |
| 2022 | $4,415 | $305,300 | $211,400 | $93,900 |
| 2021 | $4,197 | $282,800 | $199,500 | $83,300 |
| 2020 | $4,026 | $268,600 | $178,300 | $90,300 |
| 2019 | $3,847 | $254,800 | $171,400 | $83,400 |
| 2018 | $3,466 | $227,000 | $155,700 | $71,300 |
| 2017 | $3,350 | $218,500 | $149,700 | $68,800 |
| 2016 | $3,389 | $217,800 | $152,400 | $65,400 |
| 2015 | $3,080 | $196,200 | $128,900 | $67,300 |
| 2014 | $2,993 | $189,900 | $128,900 | $61,000 |
Source: Public Records
Map
Nearby Homes
- 56 North St
- 291 Plimpton St
- 881 Main St Unit 9
- 222 School St Unit 9
- 224 School St Unit 9
- 260 Elm St
- 486 Washington St
- 241 Fisher St
- 50 Riverside Place
- 1110 Main St
- 19 and 23 Arlington Ln
- 363 - 367 Washington St
- 8 Mckinley Ave
- 145 South St Unit 5
- 1 Merganser Way
- 40 Endean Dr
- 26 Dover Dr
- 38 Garden Pkwy
- 1 Providence Hwy
- 1 Palace Ct
Your Personal Tour Guide
Ask me questions while you tour the home.