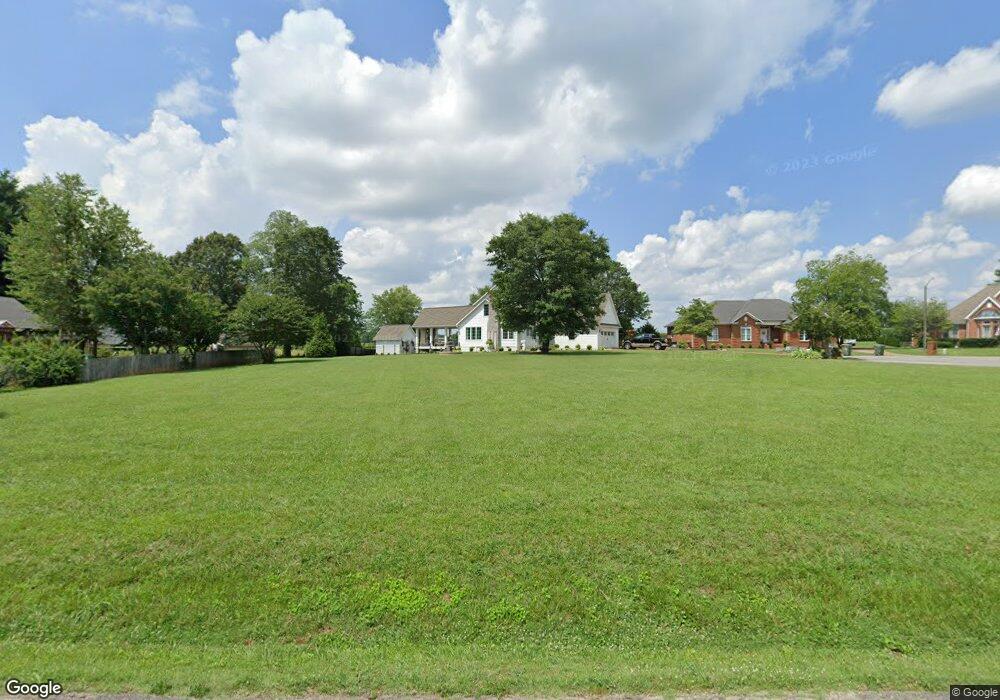
625 Red Bud Ct Lawrenceburg, TN 38464
Estimated Value: $370,185 - $468,000
--
Bed
2
Baths
2,516
Sq Ft
$166/Sq Ft
Est. Value
About This Home
This home is located at 625 Red Bud Ct, Lawrenceburg, TN 38464 and is currently estimated at $417,546, approximately $165 per square foot. 625 Red Bud Ct is a home located in Lawrence County with nearby schools including Ingram Sowell Elementary School, Lawrenceburg Public Elementary School, and David Crockett Elementary School.
Ownership History
Date
Name
Owned For
Owner Type
Purchase Details
Closed on
Dec 31, 2020
Sold by
Kelly Joni
Bought by
Sanders Bryan E and Sanders Jenna R
Current Estimated Value
Purchase Details
Closed on
Dec 9, 2009
Bought by
Kelly Joni
Purchase Details
Closed on
May 15, 1995
Sold by
Joey Smith
Bought by
John Pillow
Purchase Details
Closed on
May 2, 1994
Bought by
Smith Joey and Smith Lisa
Purchase Details
Closed on
May 2, 1988
Bought by
Braswell Larry and Braswell Linda
Create a Home Valuation Report for This Property
The Home Valuation Report is an in-depth analysis detailing your home's value as well as a comparison with similar homes in the area
Home Values in the Area
Average Home Value in this Area
Purchase History
| Date | Buyer | Sale Price | Title Company |
|---|---|---|---|
| Sanders Bryan E | -- | None Available | |
| Kelly Joni | $110,300 | -- | |
| John Pillow | $16,000 | -- | |
| Smith Joey | $16,000 | -- | |
| Braswell Larry | -- | -- |
Source: Public Records
Tax History Compared to Growth
Tax History
| Year | Tax Paid | Tax Assessment Tax Assessment Total Assessment is a certain percentage of the fair market value that is determined by local assessors to be the total taxable value of land and additions on the property. | Land | Improvement |
|---|---|---|---|---|
| 2025 | $2,974 | $95,700 | $0 | $0 |
| 2024 | $2,974 | $95,700 | $7,500 | $88,200 |
| 2023 | $2,974 | $95,700 | $7,500 | $88,200 |
| 2022 | $2,974 | $95,700 | $7,500 | $88,200 |
| 2021 | $2,644 | $60,150 | $6,250 | $53,900 |
| 2020 | $2,644 | $60,150 | $6,250 | $53,900 |
| 2019 | $2,644 | $60,150 | $6,250 | $53,900 |
| 2018 | $2,644 | $60,150 | $6,250 | $53,900 |
| 2017 | $2,644 | $60,150 | $6,250 | $53,900 |
| 2016 | $2,644 | $60,150 | $6,250 | $53,900 |
| 2015 | $2,503 | $60,150 | $6,250 | $53,900 |
| 2014 | $2,233 | $53,650 | $5,000 | $48,650 |
Source: Public Records
Map
Nearby Homes