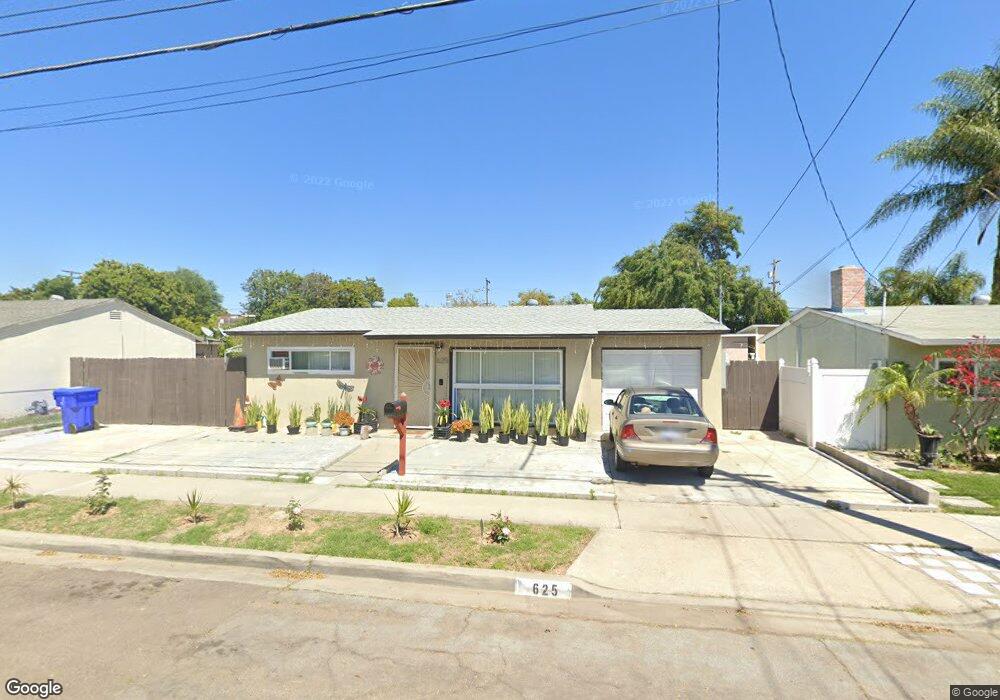
625 Rytko St San Diego, CA 92114
Jamacha Lomita NeighborhoodEstimated Value: $650,000 - $701,000
2
Beds
1
Bath
981
Sq Ft
$683/Sq Ft
Est. Value
About This Home
This home is located at 625 Rytko St, San Diego, CA 92114 and is currently estimated at $669,674, approximately $682 per square foot. 625 Rytko St is a home located in San Diego County with nearby schools including Audubon K-8, Bell Middle School, and Morse High School.
Ownership History
Date
Name
Owned For
Owner Type
Purchase Details
Closed on
Mar 25, 2015
Sold by
Reo Bay Area Lp
Bought by
Langille Patrick Andrew and Langille Catherine
Current Estimated Value
Home Financials for this Owner
Home Financials are based on the most recent Mortgage that was taken out on this home.
Original Mortgage
$14,907
Outstanding Balance
$11,467
Interest Rate
3.64%
Mortgage Type
Negative Amortization
Estimated Equity
$658,207
Purchase Details
Closed on
Mar 6, 2013
Sold by
Vitgu Benjamin P and Vitug Erlinda P
Bought by
Reo Bay Area Lp
Purchase Details
Closed on
Mar 15, 1994
Sold by
Frando Nicolai and Frando Josefina G
Bought by
Vitug Benjamin P and Vitug Erlinda P
Home Financials for this Owner
Home Financials are based on the most recent Mortgage that was taken out on this home.
Original Mortgage
$107,100
Interest Rate
7%
Mortgage Type
VA
Purchase Details
Closed on
Oct 3, 1990
Purchase Details
Closed on
Apr 30, 1986
Create a Home Valuation Report for This Property
The Home Valuation Report is an in-depth analysis detailing your home's value as well as a comparison with similar homes in the area
Home Values in the Area
Average Home Value in this Area
Purchase History
| Date | Buyer | Sale Price | Title Company |
|---|---|---|---|
| Langille Patrick Andrew | $295,000 | Fidelity National Title | |
| Reo Bay Area Lp | $160,000 | Western Resources Title Comp | |
| Vitug Benjamin P | $105,000 | Chicago Title | |
| -- | $87,500 | -- | |
| -- | $64,900 | -- |
Source: Public Records
Mortgage History
| Date | Status | Borrower | Loan Amount |
|---|---|---|---|
| Open | Langille Patrick Andrew | $14,907 | |
| Open | Langille Patrick Andrew | $280,250 | |
| Previous Owner | Vitug Benjamin P | $107,100 |
Source: Public Records
Tax History Compared to Growth
Tax History
| Year | Tax Paid | Tax Assessment Tax Assessment Total Assessment is a certain percentage of the fair market value that is determined by local assessors to be the total taxable value of land and additions on the property. | Land | Improvement |
|---|---|---|---|---|
| 2025 | $4,218 | $354,535 | $168,827 | $185,708 |
| 2024 | $4,218 | $347,584 | $165,517 | $182,067 |
| 2023 | $4,123 | $340,770 | $162,272 | $178,498 |
| 2022 | $4,011 | $334,090 | $159,091 | $174,999 |
| 2021 | $3,983 | $327,540 | $155,972 | $171,568 |
| 2020 | $3,934 | $324,182 | $154,373 | $169,809 |
| 2019 | $3,862 | $317,827 | $151,347 | $166,480 |
| 2018 | $3,610 | $311,596 | $148,380 | $163,216 |
| 2017 | $3,523 | $305,487 | $145,471 | $160,016 |
| 2016 | $3,464 | $299,498 | $142,619 | $156,879 |
| 2015 | $1,955 | $163,936 | $78,065 | $85,871 |
| 2014 | -- | $160,725 | $76,536 | $84,189 |
Source: Public Records
Map
Nearby Homes
- 7936 Pala St
- 284 Middlebush Dr
- 249 Meadowbrook Dr
- 8017 Gribble St
- 612 Cardiff St
- 101 Coolwater Dr
- 7853 Gribble St
- 721 Cardiff St
- 725 Peggy Dr
- 366 Lausanne Dr
- 7358 Gribble St
- 8585 Encinitas Way
- 256 S Royal Oak Dr
- 1062 Armacost Rd
- 7263 Aquamarine Rd
- 1277 Glencoe Dr
- 7969 Royal Oak Place
- 1134 Carlsbad St
- 1011 Carlsbad St
- 177 Coralwood Dr