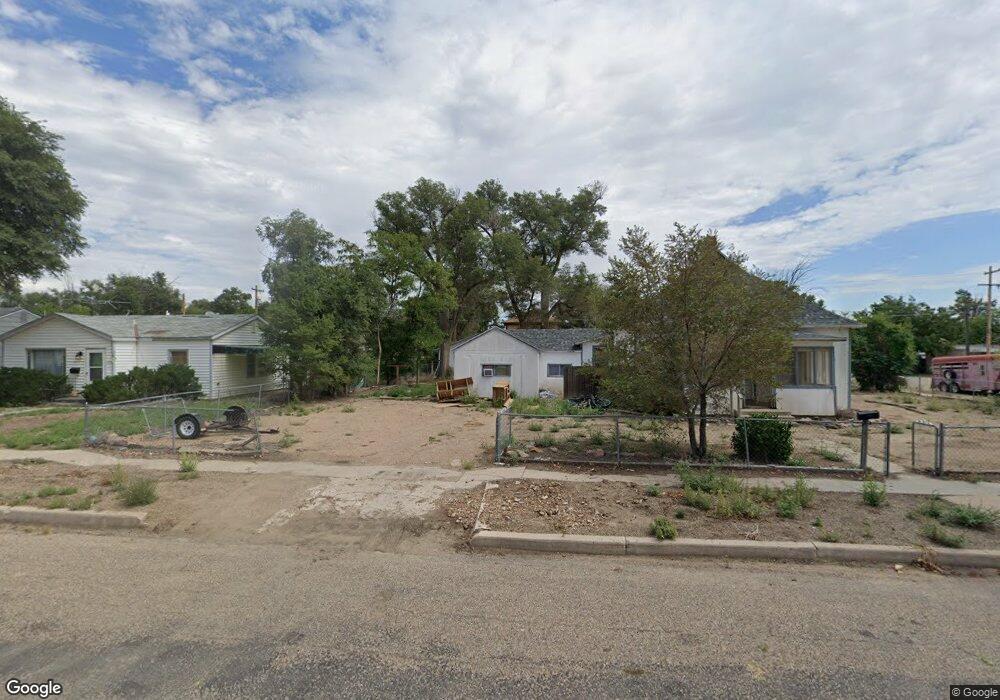
625 Sherman Ave Ordway, CO 81063
Estimated Value: $95,000 - $144,000
3
Beds
1
Bath
1,020
Sq Ft
$111/Sq Ft
Est. Value
About This Home
This home is located at 625 Sherman Ave, Ordway, CO 81063 and is currently estimated at $113,389, approximately $111 per square foot. 625 Sherman Ave is a home located in Crowley County with nearby schools including Crowley County Ward Intermediate and Crowley County Junior & Senior High School.
Ownership History
Date
Name
Owned For
Owner Type
Purchase Details
Closed on
Mar 7, 2014
Sold by
Medina Mary A
Bought by
Collins Elissa L
Current Estimated Value
Purchase Details
Closed on
Jan 7, 2011
Sold by
Mcmillian Terry
Bought by
Medina Mary A
Purchase Details
Closed on
Jan 5, 2011
Sold by
Federal Home Loan Mortgage Corporation
Bought by
Mcmillian Terry
Purchase Details
Closed on
Jul 14, 2010
Sold by
Johnson Tessa and Johnson Melissa
Bought by
Federal Home Loan Mortgage Corp
Purchase Details
Closed on
Jun 29, 2010
Sold by
Us Bankna
Bought by
Federal Home Loan Assignment
Purchase Details
Closed on
May 28, 2010
Sold by
Johnson Tessa and Johnson Melissa
Bought by
Cert Of Purchase
Purchase Details
Closed on
Aug 4, 2009
Sold by
Johnson Tessa and Johnson Melissa
Bought by
Notice Of Election And Demand For Sale
Purchase Details
Closed on
Jun 8, 2007
Sold by
Johnson Tessa and Johnson Melissa
Bought by
Withdrawl Of Sale By Pt
Create a Home Valuation Report for This Property
The Home Valuation Report is an in-depth analysis detailing your home's value as well as a comparison with similar homes in the area
Home Values in the Area
Average Home Value in this Area
Purchase History
| Date | Buyer | Sale Price | Title Company |
|---|---|---|---|
| Collins Elissa L | $22,300 | -- | |
| Medina Mary A | $12,200 | -- | |
| Mcmillian Terry | $12,200 | -- | |
| Federal Home Loan Mortgage Corp | -- | -- | |
| Federal Home Loan Assignment | -- | -- | |
| Cert Of Purchase | -- | -- | |
| Notice Of Election And Demand For Sale | -- | -- | |
| Withdrawl Of Sale By Pt | -- | -- |
Source: Public Records
Tax History Compared to Growth
Tax History
| Year | Tax Paid | Tax Assessment Tax Assessment Total Assessment is a certain percentage of the fair market value that is determined by local assessors to be the total taxable value of land and additions on the property. | Land | Improvement |
|---|---|---|---|---|
| 2024 | $133 | $1,341 | $24 | $1,317 |
| 2023 | $132 | $1,341 | $24 | $1,317 |
| 2022 | $342 | $3,647 | $94 | $3,553 |
| 2021 | $336 | $3,752 | $97 | $3,655 |
| 2020 | $325 | $3,752 | $97 | $3,655 |
| 2019 | $347 | $3,752 | $97 | $3,655 |
| 2018 | $249 | $2,621 | $97 | $2,524 |
| 2017 | $244 | $2,621 | $97 | $2,524 |
| 2016 | $247 | $2,900 | $110 | $2,790 |
| 2015 | $254 | $2,900 | $110 | $2,790 |
| 2014 | $254 | $2,900 | $110 | $2,790 |
| 2013 | $252 | $2,900 | $110 | $2,790 |
| 2012 | $259 | $2,900 | $110 | $2,790 |
Source: Public Records
Map
Nearby Homes
- 504 Sherman Ave
- 410 Idaho Ave
- 113 W 5th St
- 326 Sherman Ave
- 8534 Lane 14
- 310 Colorado Ave
- 204 E 3rd St
- 524 Arkansas Ave
- 217 Idaho Ave
- 214 Short Ave
- 316 Arkansas Ave
- 304 Arkansas Ave
- 429 Mountain View
- 429 Mount View Ave
- 123 Arkansas Ave
- 600 W 3rd St
- TBD County Lane 17
- 19469 County Road H
- 18761 County Road J
- 8618 Maverick Ln
- 617 Sherman Ave
- 605 Sherman Ave
- 621 Sherman Ave
- 629 Sherman Ave
- 609 Sherman Ave
- 610 Sherman Ave
- 624 Sherman Ave
- 618 Sherman Ave
- 632 Sherman Ave
- 632 Idaho Ave
- 628 Idaho Ave
- 620 Idaho Ave
- 616 Idaho Ave
- 608 Idaho Ave
- 628 Idaho Ave Unit 28+`
- 220 E 7th St
- 212 E 7th St
- 202 E 7th St
- 212 E 7th St Unit n/a
- 110 E 7th St