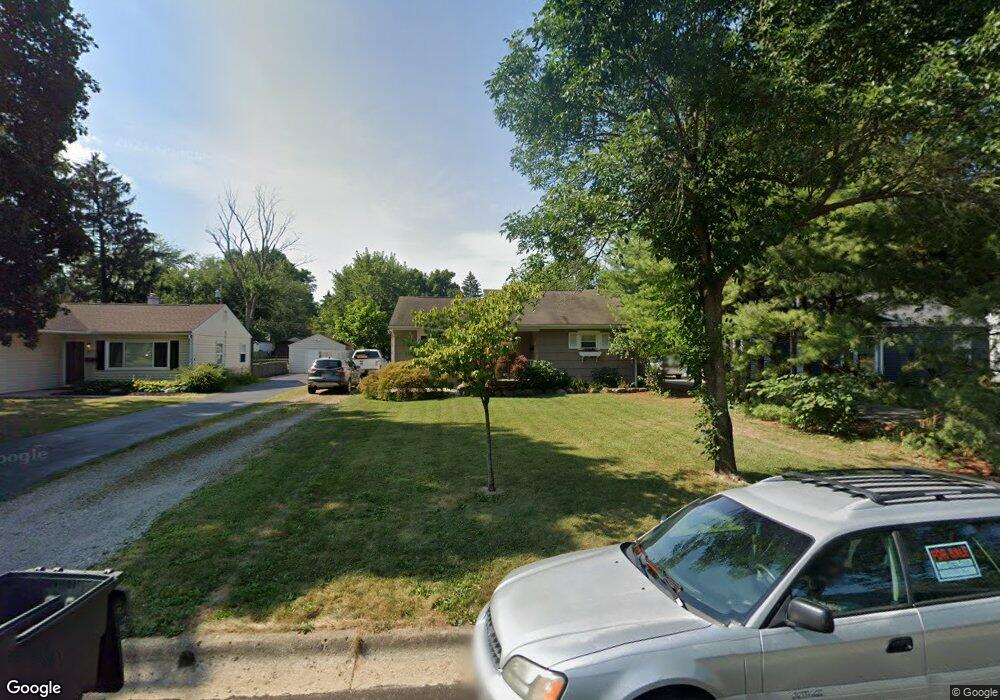
625 Wetmore Rd Columbus, OH 43214
Clintonville NeighborhoodEstimated Value: $344,000 - $416,000
3
Beds
1
Bath
948
Sq Ft
$411/Sq Ft
Est. Value
About This Home
This home is located at 625 Wetmore Rd, Columbus, OH 43214 and is currently estimated at $389,489, approximately $410 per square foot. 625 Wetmore Rd is a home located in Franklin County with nearby schools including Colerain Elementary School, Dominion Middle School, and Whetstone High School.
Ownership History
Date
Name
Owned For
Owner Type
Purchase Details
Closed on
Sep 22, 2009
Sold by
Dehoff Bradley R and Dehoff Patricia L
Bought by
Hill Joann F
Current Estimated Value
Home Financials for this Owner
Home Financials are based on the most recent Mortgage that was taken out on this home.
Original Mortgage
$147,283
Outstanding Balance
$96,323
Interest Rate
5.19%
Mortgage Type
FHA
Estimated Equity
$293,166
Purchase Details
Closed on
Aug 27, 2002
Sold by
Poppy Timothy J and Poppy Amelia C
Bought by
Dehoff Bradley R and Dehoff Ryan R
Home Financials for this Owner
Home Financials are based on the most recent Mortgage that was taken out on this home.
Original Mortgage
$126,469
Interest Rate
6.54%
Mortgage Type
FHA
Purchase Details
Closed on
Oct 20, 1992
Create a Home Valuation Report for This Property
The Home Valuation Report is an in-depth analysis detailing your home's value as well as a comparison with similar homes in the area
Home Values in the Area
Average Home Value in this Area
Purchase History
| Date | Buyer | Sale Price | Title Company |
|---|---|---|---|
| Hill Joann F | $150,000 | Amerititle | |
| Dehoff Bradley R | $127,500 | Chicago Title | |
| -- | $4,200 | -- |
Source: Public Records
Mortgage History
| Date | Status | Borrower | Loan Amount |
|---|---|---|---|
| Open | Hill Joann F | $147,283 | |
| Previous Owner | Dehoff Bradley R | $126,469 |
Source: Public Records
Tax History Compared to Growth
Tax History
| Year | Tax Paid | Tax Assessment Tax Assessment Total Assessment is a certain percentage of the fair market value that is determined by local assessors to be the total taxable value of land and additions on the property. | Land | Improvement |
|---|---|---|---|---|
| 2024 | $5,285 | $117,750 | $54,850 | $62,900 |
| 2023 | $5,217 | $117,740 | $54,845 | $62,895 |
| 2022 | $4,317 | $83,230 | $44,310 | $38,920 |
| 2021 | $4,324 | $83,230 | $44,310 | $38,920 |
| 2020 | $4,288 | $82,430 | $44,310 | $38,120 |
| 2019 | $3,796 | $62,580 | $34,090 | $28,490 |
| 2018 | $3,479 | $62,580 | $34,090 | $28,490 |
| 2017 | $3,643 | $62,580 | $34,090 | $28,490 |
| 2016 | $3,492 | $52,720 | $19,780 | $32,940 |
| 2015 | $3,170 | $52,720 | $19,780 | $32,940 |
| 2014 | $3,178 | $52,720 | $19,780 | $32,940 |
| 2013 | $1,492 | $50,190 | $18,830 | $31,360 |
Source: Public Records
Map
Nearby Homes
- 646 E Beechwold Blvd
- 601 Morse Rd
- 475 Garden Rd
- 420 E Beechwold Blvd
- 411 Garden Rd
- 4508 Glenmawr Ave
- 381 E Jeffrey Place
- 224 Morse Rd
- 4299 Colerain Ave
- 343 E Jeffrey Place
- 814 Meadowview Dr
- 4193 Eastlea Dr
- 255 Garden Rd
- 1004 Marland Dr N
- 247 E Jeffrey Place
- 278 E Dominion Blvd
- 1071 Loring Rd
- 243 E Schreyer Place
- 156 E Weisheimer Rd
- 4441 Wetmore Rd E
- 633 Wetmore Rd
- 615 Wetmore Rd
- 641 Wetmore Rd
- 649 Wetmore Rd
- 599 Wetmore Rd
- 622 E Beaumont Rd
- 616 E Beaumont Rd
- 632 E Beaumont Rd
- 640 E Beaumont Rd
- 608 E Beaumont Rd
- 624 Wetmore Rd
- 632 Wetmore Rd
- 657 Wetmore Rd
- 593 Wetmore Rd
- 616 Wetmore Rd
- 648 E Beaumont Rd
- 600 E Beaumont Rd
- 648 Wetmore Rd
- 600 Wetmore Rd
- 585 Wetmore Rd