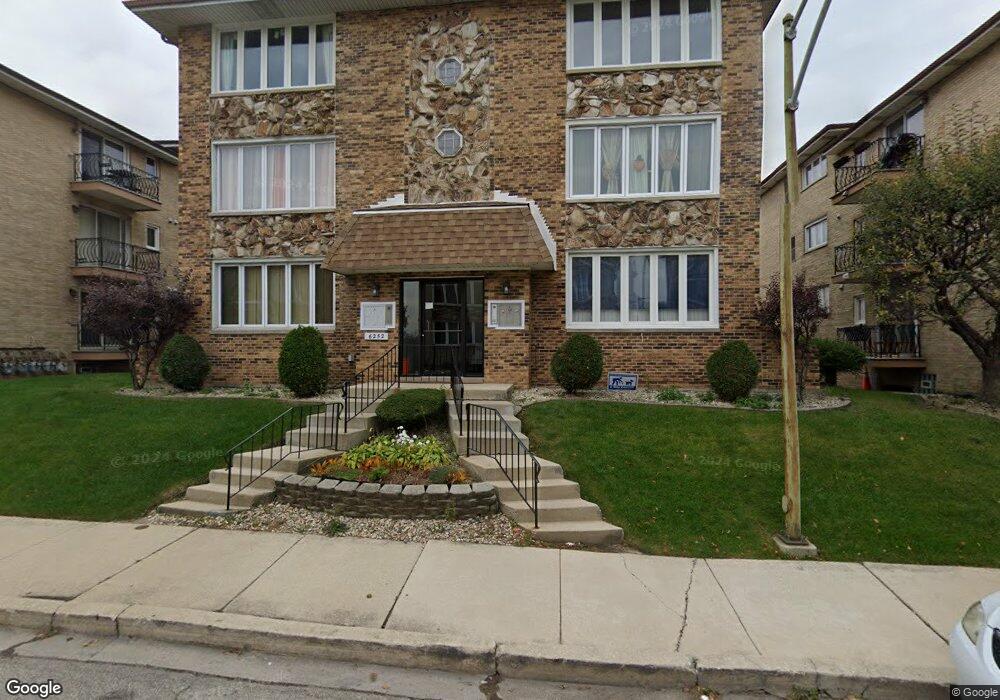
6252 S Newland Ave Unit 21S Chicago, IL 60638
Clearing NeighborhoodEstimated Value: $224,000 - $251,254
--
Bed
--
Bath
--
Sq Ft
1.39
Acres
About This Home
This home is located at 6252 S Newland Ave Unit 21S, Chicago, IL 60638 and is currently estimated at $235,314. 6252 S Newland Ave Unit 21S is a home located in Cook County with nearby schools including Dore Elementary School, Kennedy High School, and Peckwas Preparatory Academy.
Ownership History
Date
Name
Owned For
Owner Type
Purchase Details
Closed on
Jan 23, 2025
Sold by
Trust Number 30439 and Marquette Bank
Bought by
Michaels Lucas F
Current Estimated Value
Home Financials for this Owner
Home Financials are based on the most recent Mortgage that was taken out on this home.
Original Mortgage
$218,500
Outstanding Balance
$217,003
Interest Rate
6.88%
Mortgage Type
New Conventional
Estimated Equity
$18,311
Purchase Details
Closed on
Dec 9, 2019
Sold by
Szarek Jan and Szarek Aniela
Bought by
Marquette Bank and Trust Number 30439
Purchase Details
Closed on
May 16, 2014
Sold by
Kotrba Esther and Budzinski Joseph
Bought by
Szarek Jan and Szarek Aniela
Purchase Details
Closed on
Aug 8, 2003
Sold by
Wozniak Bernadette A
Bought by
Kotrba Esther and Budzinski Joseph E
Purchase Details
Closed on
Jul 23, 2001
Sold by
Przyzycki John E
Bought by
Przyzycki John E and The John E Przyzycki Trust
Create a Home Valuation Report for This Property
The Home Valuation Report is an in-depth analysis detailing your home's value as well as a comparison with similar homes in the area
Home Values in the Area
Average Home Value in this Area
Purchase History
| Date | Buyer | Sale Price | Title Company |
|---|---|---|---|
| Michaels Lucas F | $230,000 | Old Republic Title | |
| Marquette Bank | -- | None Available | |
| Szarek Jan | $95,000 | Fidelity National Title | |
| Kotrba Esther | $125,000 | Multiple | |
| Przyzycki John E | -- | -- |
Source: Public Records
Mortgage History
| Date | Status | Borrower | Loan Amount |
|---|---|---|---|
| Open | Michaels Lucas F | $218,500 |
Source: Public Records
Tax History Compared to Growth
Tax History
| Year | Tax Paid | Tax Assessment Tax Assessment Total Assessment is a certain percentage of the fair market value that is determined by local assessors to be the total taxable value of land and additions on the property. | Land | Improvement |
|---|---|---|---|---|
| 2024 | $2,479 | $17,818 | $1,443 | $16,375 |
| 2023 | $2,395 | $15,000 | $1,288 | $13,712 |
| 2022 | $2,395 | $15,000 | $1,288 | $13,712 |
| 2021 | $2,346 | $14,999 | $1,288 | $13,711 |
| 2020 | $1,511 | $9,841 | $1,030 | $8,811 |
| 2019 | $1,521 | $10,951 | $1,030 | $9,921 |
| 2018 | $1,494 | $10,951 | $1,030 | $9,921 |
| 2017 | $1,948 | $8,988 | $927 | $8,061 |
| 2016 | $1,812 | $8,988 | $927 | $8,061 |
| 2015 | $1,659 | $8,988 | $927 | $8,061 |
| 2014 | $787 | $8,611 | $875 | $7,736 |
| 2013 | $336 | $8,611 | $875 | $7,736 |
Source: Public Records
Map
Nearby Homes
- 6857 W 63rd Place
- 6850 W 64th St
- 6927 W 64th Place Unit 2E
- 6419 S Oak Park Ave Unit E-25
- 7216 W 63rd Place
- 7224 W 63rd Place
- 7241 W 62nd St
- 6659 W 64th Place Unit 305
- 6031 S Normandy Ave
- 6206 S Nashville Ave
- 6637 W 64th Place
- 6104 S Nashville Ave
- 7330 W 61st Place
- 5950 S Natoma Ave
- 6020 S Nashville Ave
- 7409 W 63rd Place
- 7400 W 61st St
- 7211 W 58th Place
- 5820 S Rutherford Ave
- 5745 S Sayre Ave
- 6260 S Newland Ave Unit 12S
- 6260 S Newland Ave Unit 12N
- 6260 S Newland Ave Unit 11N
- 6260 S Newland Ave Unit 11S
- 6260 S Newland Ave Unit 13N
- 6260 S Newland Ave Unit 13S
- 6260 S Newland Ave Unit 1N
- 6260 S Newland Ave Unit 3N
- 6252 S Newland Ave Unit 23N
- 6252 S Newland Ave Unit 21N
- 6252 S Newland Ave Unit 22S
- 6252 S Newland Ave Unit 22N
- 6252 S Newland Ave Unit 23S
- 6252 S Newland Ave Unit 3N
- 6252 S Newland Ave Unit 2N
- 6252 S Newland Ave Unit 2S
- 6940 W 63rd Place
- 6244 S Newland Ave Unit 1N
- 6244 S Newland Ave Unit 73S
- 6244 S Newland Ave Unit 72N