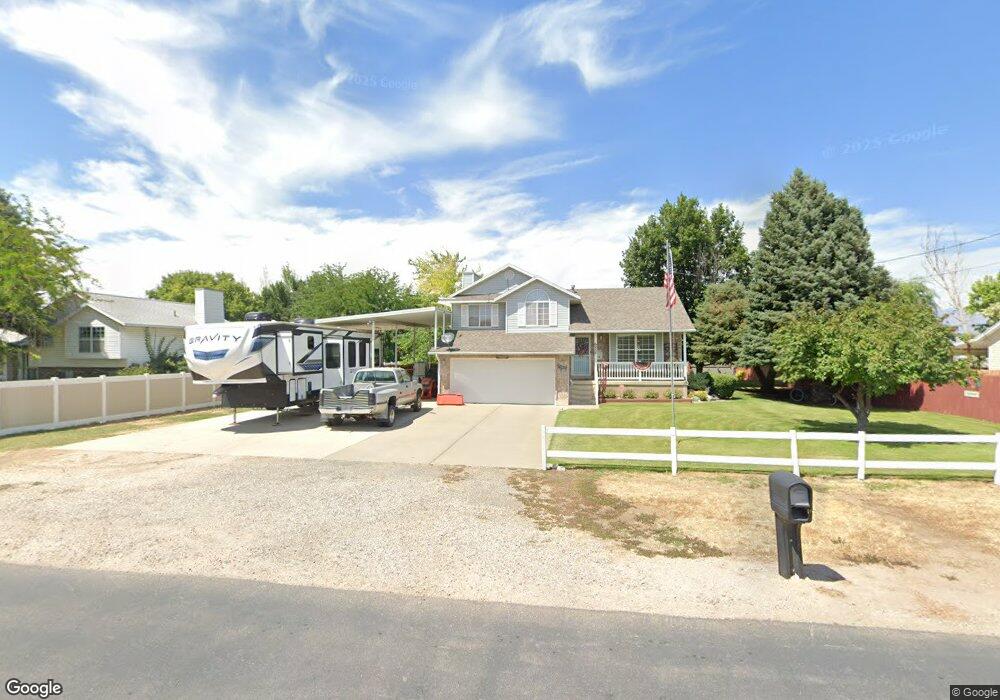
6254 W 5100 S Hooper, UT 84315
Estimated Value: $534,000 - $619,000
3
Beds
2
Baths
1,926
Sq Ft
$293/Sq Ft
Est. Value
About This Home
This home is located at 6254 W 5100 S, Hooper, UT 84315 and is currently estimated at $565,000, approximately $293 per square foot. 6254 W 5100 S is a home located in Weber County with nearby schools including Hooper Elementary School, Rocky Mountain Junior High School, and Fremont High School.
Ownership History
Date
Name
Owned For
Owner Type
Purchase Details
Closed on
Mar 8, 2021
Sold by
Martinez Dennis John and Martinez Fleurette P
Bought by
Martinez Dennis John and Martinez Fleurette P
Current Estimated Value
Home Financials for this Owner
Home Financials are based on the most recent Mortgage that was taken out on this home.
Original Mortgage
$213,250
Interest Rate
2.73%
Mortgage Type
VA
Purchase Details
Closed on
Jun 14, 2019
Sold by
Martinez Dennis J and Martinez Fleurette P
Bought by
Martinez Dennis John and Martinez Fleurette P
Purchase Details
Closed on
Sep 10, 2009
Sold by
Martinez Fleurette P and Martinez Dennis J
Bought by
Martinez Dennis J and Martinez Fleurette P
Home Financials for this Owner
Home Financials are based on the most recent Mortgage that was taken out on this home.
Original Mortgage
$243,678
Interest Rate
5.2%
Mortgage Type
FHA
Purchase Details
Closed on
Jul 22, 1996
Sold by
Martinez Fleurette P and Martinez Dennis J
Bought by
Martinez Dennis J and Martinez Fleurette P
Create a Home Valuation Report for This Property
The Home Valuation Report is an in-depth analysis detailing your home's value as well as a comparison with similar homes in the area
Home Values in the Area
Average Home Value in this Area
Purchase History
| Date | Buyer | Sale Price | Title Company |
|---|---|---|---|
| Martinez Dennis John | -- | Timios Inc | |
| Martinez Dennis John | -- | None Available | |
| Martinez Dennis J | -- | None Available | |
| Martinez Dennis J | -- | Associated Title |
Source: Public Records
Mortgage History
| Date | Status | Borrower | Loan Amount |
|---|---|---|---|
| Closed | Martinez Dennis John | $213,250 | |
| Closed | Martinez Dennis J | $243,678 |
Source: Public Records
Tax History Compared to Growth
Tax History
| Year | Tax Paid | Tax Assessment Tax Assessment Total Assessment is a certain percentage of the fair market value that is determined by local assessors to be the total taxable value of land and additions on the property. | Land | Improvement |
|---|---|---|---|---|
| 2025 | $2,104 | $461,763 | $160,895 | $300,868 |
| 2024 | $2,040 | $249,149 | $88,492 | $160,657 |
| 2023 | $2,167 | $242,000 | $81,187 | $160,813 |
| 2022 | $2,180 | $244,200 | $64,518 | $179,682 |
| 2021 | $1,743 | $341,000 | $87,666 | $253,334 |
| 2020 | $1,665 | $304,000 | $51,624 | $252,376 |
| 2019 | $1,923 | $278,000 | $38,750 | $239,250 |
| 2018 | $1,722 | $238,000 | $33,760 | $204,240 |
| 2017 | $1,569 | $210,000 | $33,747 | $176,253 |
| 2016 | $1,513 | $109,317 | $23,637 | $85,680 |
| 2015 | $1,437 | $102,359 | $20,759 | $81,600 |
| 2014 | $1,398 | $96,882 | $25,303 | $71,579 |
Source: Public Records
Map
Nearby Homes
- 6014 W 5300 S
- 6036 W 4700 S
- 6360 W 5500 S
- 0 W 5500 S
- 3729 S 5600 W Unit 6
- 3720 S 5600 W Unit 2
- 3719 S 5600 W Unit 7
- 4146 S 5800 W Unit 5
- 4163 S 5800 W Unit 2
- 5319 S 7100 W
- 5335 W 5500 S
- 5801 S 7100 W
- 3632 S 5400 W
- 5752 W 2425 N
- 4879 S 5050 W
- 4111 S 5350 W
- 4100 S 5900 W
- 3191 S 5100 St W Unit 1
- 3706 S 5650 W Unit 9
- 3691 S 5600 W Unit 20