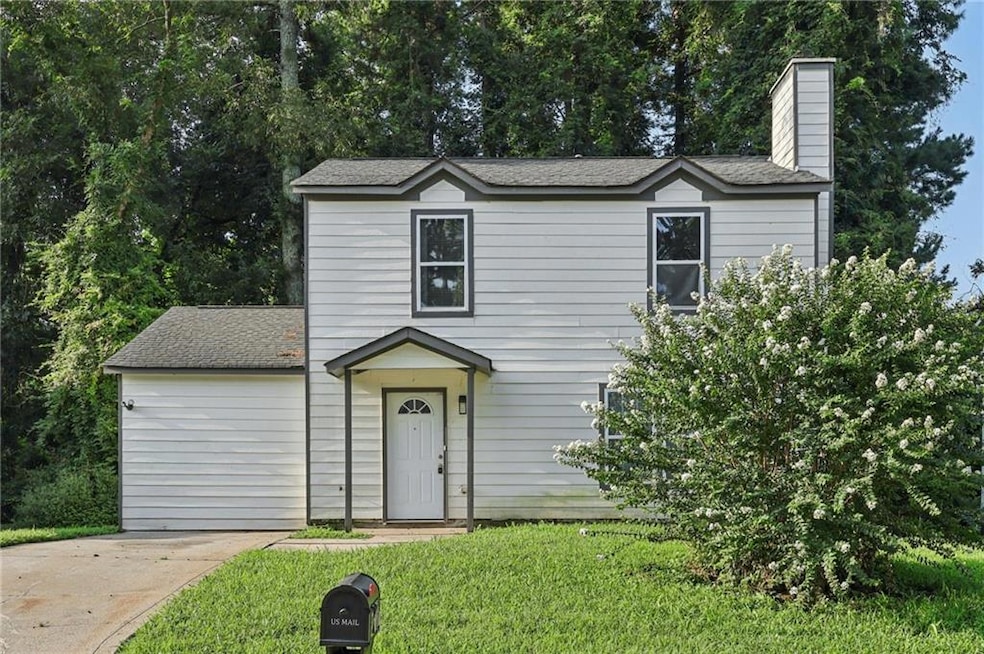
6255 Creekford Ln Unit 4 Lithonia, GA 30058
Estimated payment $1,733/month
Highlights
- Traditional Architecture
- Solid Surface Countertops
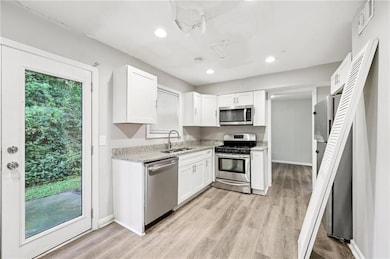
- White Kitchen Cabinets
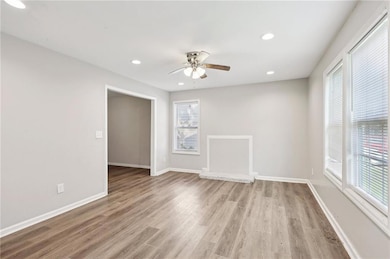
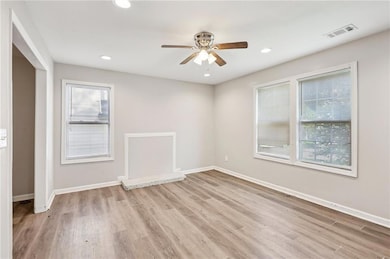
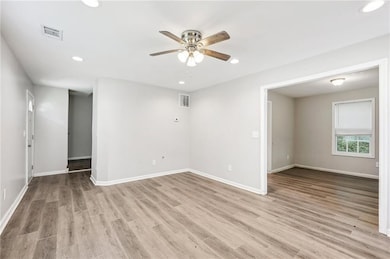
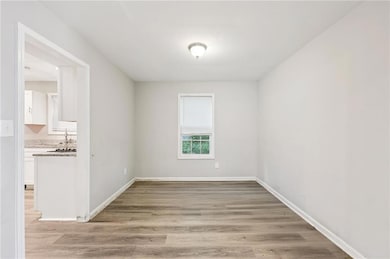
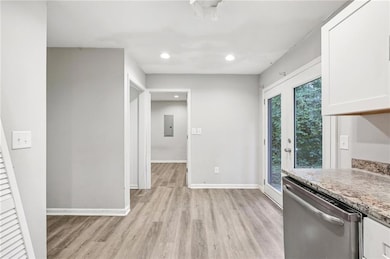
- Wood Flooring
- Formal Dining Room
- 4 Car Attached Garage
About This Home
Welcome to 6255 Creekford Ln, Lithonia, GA 30058 – a charming 3-bedroom, 2.5-bathroom home offering plenty of potential. This property features an updated kitchen and bathrooms, providing a modern touch while leaving room for your personal finishing style. The spacious backyard with patio is perfect for relaxing or entertaining. Being sold as-is, this home is ideal for investors or buyers looking for a value-add opportunity. Conveniently located near schools, shopping, and major highways, it offers both comfort and accessibility. Don’t miss this chance to own a property with great upside in a growing area!
Listing Agent
Dominic Ray
Redfin Corporation License #378997 Listed on: 09/05/2025

Home Details
Home Type
- Single Family
Est. Annual Taxes
- $4,701
Year Built
- Built in 1986
Lot Details
- 6,534 Sq Ft Lot
- Lot Dimensions are 106 x 60
- Back and Front Yard
Home Design
- Traditional Architecture
- Shingle Roof
Interior Spaces
- 1,488 Sq Ft Home
- 2-Story Property
- Double Pane Windows
- Insulated Windows
- Formal Dining Room
- Wood Flooring
- Laundry on main level
Kitchen
- Electric Range
- Microwave
- Dishwasher
- Solid Surface Countertops
- White Kitchen Cabinets
Bedrooms and Bathrooms
- Bathtub and Shower Combination in Primary Bathroom
Home Security
- Carbon Monoxide Detectors
- Fire and Smoke Detector
Parking
- 4 Car Attached Garage
- Driveway
Outdoor Features
- Patio
Schools
- Panola Way Elementary School
- Lithonia Middle School
- Lithonia High School
Utilities
- Central Heating and Cooling System
- 110 Volts
Listing and Financial Details
- Legal Lot and Block 14 / B
- Assessor Parcel Number 16 103 06 117
Map
Home Values in the Area
Average Home Value in this Area
Tax History
| Year | Tax Paid | Tax Assessment Tax Assessment Total Assessment is a certain percentage of the fair market value that is determined by local assessors to be the total taxable value of land and additions on the property. | Land | Improvement |
|---|---|---|---|---|
| 2025 | $4,600 | $95,560 | $15,000 | $80,560 |
| 2024 | $4,701 | $97,920 | $15,000 | $82,920 |
| 2023 | $4,701 | $89,640 | $15,000 | $74,640 |
| 2022 | $1,461 | $26,160 | $15,000 | $11,160 |
| 2021 | $2,253 | $44,200 | $5,120 | $39,080 |
| 2020 | $1,702 | $31,640 | $5,120 | $26,520 |
| 2019 | $1,635 | $30,120 | $5,120 | $25,000 |
| 2018 | $1,390 | $22,640 | $5,120 | $17,520 |
| 2017 | $1,359 | $23,720 | $5,120 | $18,600 |
| 2016 | $1,425 | $25,160 | $5,120 | $20,040 |
| 2014 | $1,411 | $24,240 | $5,120 | $19,120 |
Property History
| Date | Event | Price | List to Sale | Price per Sq Ft |
|---|---|---|---|---|
| 09/05/2025 09/05/25 | For Sale | $255,000 | -- | $171 / Sq Ft |
Purchase History
| Date | Type | Sale Price | Title Company |
|---|---|---|---|
| Warranty Deed | $246,800 | -- | |
| Warranty Deed | $197,500 | -- | |
| Warranty Deed | $70,342 | -- | |
| Deed | $6,000 | -- |
Mortgage History
| Date | Status | Loan Amount | Loan Type |
|---|---|---|---|
| Open | $185,097 | New Conventional | |
| Previous Owner | $110,000 | Commercial | |
| Closed | $0 | FHA |
Source: First Multiple Listing Service (FMLS)
MLS Number: 7638083
APN: 16-103-06-117
Disclaimer: Certain information contained herein is derived from information provided by parties other than Homes.com. All information provided is deemed reliable, but is not guaranteed to be accurate and should be independently verified.
![]() Listings identified with the FMLS IDX logo come from FMLS and are held by brokerage firms other than the owner of this website. The listing brokerage is identified in any listing details. Information is deemed reliable but is not guaranteed. If you believe any FMLS listing contains material that infringes your copyrighted work please visit www.fmls.com/dmca to review our DMCA policy and learn how to submit a takedown request. © 2025 First Multiple Listing Service, Inc.
Listings identified with the FMLS IDX logo come from FMLS and are held by brokerage firms other than the owner of this website. The listing brokerage is identified in any listing details. Information is deemed reliable but is not guaranteed. If you believe any FMLS listing contains material that infringes your copyrighted work please visit www.fmls.com/dmca to review our DMCA policy and learn how to submit a takedown request. © 2025 First Multiple Listing Service, Inc.
- 6248 Creekford Ln
- 6235 Creekford Ln
- 6218 Creekford Ln
- 6117 Creekford Dr
- 2294 Wellington Cir Unit 2294
- 6241 Noreen Way
- 6300 Creekford Ln
- 2360 Anne's Lake Cir
- 2356 Cove Rd
- 6317 Creekford Ln
- 2590 Wellington Walk Place
- 6175 Creekford Dr
- 6315 Noreen Way
- 2173 Wellington Cir
- 2216 Marbut Farms Trace
- 6318 Wellington Walk Way
- 2222 Wellington Cir
- 2623 Wellington Walk Place
- 2190 Wellington Cir
- 2596 Wellington Walk Place
- 2187 Wellington Cir
- 2391 Cove Rd
- 2398 Cragstone Ct Unit 2398 Cragstone CT, Lithon
- 6238 Marbut Farms Ln
- 6367 Kennonbriar Ct
- 2287 Rambling Way
- 6301 Marbut Farms Trail
- 2281 Rambling Way
- 6410 Kennonbriar Ct
- 6412 Kennonbriar Ct
- 2239 Cherokee Valley Cir
- 2325 Woodcrest Walk
- 6544 Wellington Chase Ct
- 2227 Cherokee Valley Cir
- 10 Arbor Crossing Dr
- 2318 Cherokee Valley Cir
- 6017 Happy Trails Ct
- 6026 Old Wellborn Trace
- 6075 Cherokee Valley Ln