J
Landlord's Agent in 2012
Jill Cromartie
Simple Asset Management
(404) 919-0644
1 Total Sale
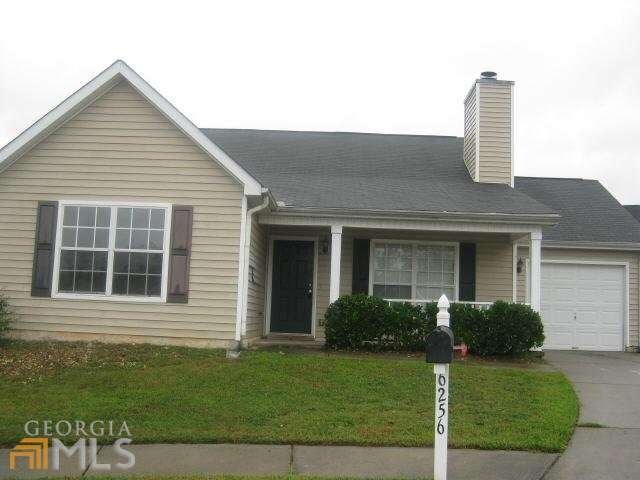
Estimated Value: $230,000 - $261,000
COZY, RENOVATED HOME IS MOVE-IN READY. THIS RANCH HOME HAS LOTS OF CHARM AND APPEAL WITH NEW FLOORING, FRESH PAINT, BUILT-IN MANTLE/SHELVES AND FIREPLACE. THIS WILL
Last Agent to Rent the Property
Simple Asset Management License #257050 Listed on: 09/29/2012
| Date | Buyer | Sale Price | Title Company |
|---|---|---|---|
| Halimax Properties Llc | -- | -- | |
| Dreamquarters Llc | $44,000 | -- | |
| Secretary Of Housing And Urban | $125,280 | -- | |
| Citimortgage Inc | $125,280 | -- | |
| Leacock Althea L | $117,900 | -- |
| Date | Status | Borrower | Loan Amount |
|---|---|---|---|
| Previous Owner | Leacock Althea L | $116,078 |
| Date | Event | Price | List to Sale | Price per Sq Ft | Prior Sale |
|---|---|---|---|---|---|
| 11/14/2012 11/14/12 | Rented | $900 | -2.7% | -- | |
| 10/15/2012 10/15/12 | Under Contract | -- | -- | -- | |
| 09/29/2012 09/29/12 | For Rent | $925 | 0.0% | -- | |
| 08/07/2012 08/07/12 | Sold | $44,000 | 0.0% | $31 / Sq Ft | View Prior Sale |
| 07/08/2012 07/08/12 | Pending | -- | -- | -- | |
| 05/01/2012 05/01/12 | For Sale | $44,000 | -- | $31 / Sq Ft |
| Year | Tax Paid | Tax Assessment Tax Assessment Total Assessment is a certain percentage of the fair market value that is determined by local assessors to be the total taxable value of land and additions on the property. | Land | Improvement |
|---|---|---|---|---|
| 2025 | $4,940 | $100,320 | $18,000 | $82,320 |
| 2024 | $4,043 | $80,840 | $9,701 | $71,139 |
| 2023 | $4,043 | $80,840 | $9,701 | $71,139 |
| 2022 | $2,969 | $80,840 | $10,000 | $70,840 |
| 2021 | $3,010 | $59,720 | $6,760 | $52,960 |
| 2020 | $2,432 | $47,240 | $6,760 | $40,480 |
| 2019 | $2,469 | $48,400 | $6,760 | $41,640 |
| 2018 | $2,086 | $45,640 | $6,760 | $38,880 |
| 2017 | $1,935 | $34,040 | $6,760 | $27,280 |
| 2016 | $1,806 | $33,080 | $6,760 | $26,320 |
| 2014 | $1,221 | $38,400 | $6,760 | $31,640 |
J
Landlord's Agent in 2012
Jill Cromartie
Simple Asset Management
(404) 919-0644
1 Total Sale
M
Seller's Agent in 2012
MARCUS SHIRLEY
Virtual Properties Realty.com
(404) 309-8709
15 Total Sales
M
Buyer's Agent in 2012
MYA BERLYANT
NOT A VALID MEMBER
Source: Georgia MLS
MLS Number: 03289814
APN: 11-231-09-015
Disclaimer: Certain information contained herein is derived from information provided by parties other than Homes.com. All information provided is deemed reliable, but is not guaranteed to be accurate and should be independently verified.
![]() The data relating to real estate for sale on this web site comes in part from the Broker Reciprocity Program of Georgia MLS. Real estate listings held by brokerage firms other than Redfin are marked with the Broker Reciprocity logo and detailed information about them includes the name of the listing brokers. Information deemed reliable but not guaranteed. Copyright 2025 Georgia MLS. All rights reserved.
The data relating to real estate for sale on this web site comes in part from the Broker Reciprocity Program of Georgia MLS. Real estate listings held by brokerage firms other than Redfin are marked with the Broker Reciprocity logo and detailed information about them includes the name of the listing brokers. Information deemed reliable but not guaranteed. Copyright 2025 Georgia MLS. All rights reserved.
