Estimated Value: $642,000 - $709,000
2
Beds
2
Baths
1,087
Sq Ft
$627/Sq Ft
Est. Value
About This Home
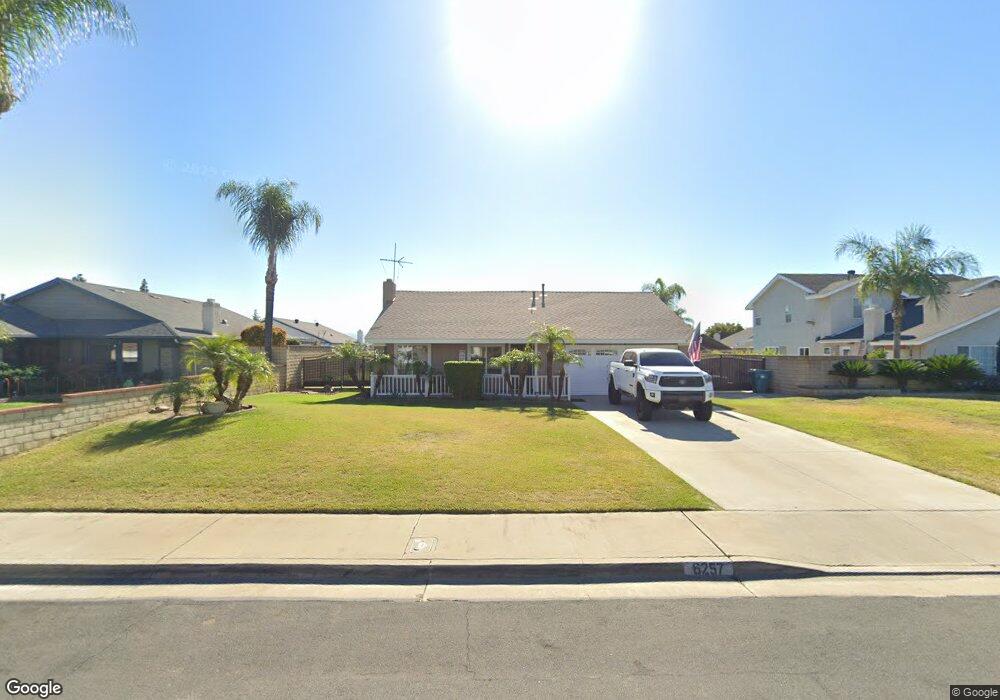
This home is located at 6257 Serene Ct, Chino, CA 91710 and is currently estimated at $681,665, approximately $627 per square foot. 6257 Serene Ct is a home located in San Bernardino County with nearby schools including Alicia Cortez Elementary, Magnolia Junior High, and Chino High School.
Ownership History
Date
Name
Owned For
Owner Type
Purchase Details
Closed on
Feb 18, 2025
Sold by
Tellez Maritza
Bought by
Tellez Maritza
Current Estimated Value
Home Financials for this Owner
Home Financials are based on the most recent Mortgage that was taken out on this home.
Original Mortgage
$502,500
Outstanding Balance
$499,589
Interest Rate
7.04%
Mortgage Type
New Conventional
Estimated Equity
$182,076
Purchase Details
Closed on
Sep 28, 2023
Sold by
Tellez Victor and Tellez Martha
Bought by
Tellez Maritza
Home Financials for this Owner
Home Financials are based on the most recent Mortgage that was taken out on this home.
Original Mortgage
$396,000
Interest Rate
7.23%
Mortgage Type
New Conventional
Purchase Details
Closed on
Dec 8, 1997
Sold by
Clark Scott D and Garcia Clark Sandra
Bought by
Tellez Victor and Tellez Martha
Home Financials for this Owner
Home Financials are based on the most recent Mortgage that was taken out on this home.
Original Mortgage
$116,950
Interest Rate
7.16%
Create a Home Valuation Report for This Property
The Home Valuation Report is an in-depth analysis detailing your home's value as well as a comparison with similar homes in the area
Home Values in the Area
Average Home Value in this Area
Purchase History
| Date | Buyer | Sale Price | Title Company |
|---|---|---|---|
| Tellez Maritza | -- | Atlas Title | |
| Tellez Maritza | $440,000 | Atlas Title | |
| Tellez Maritza | -- | Atlas Title | |
| Tellez Victor | $130,000 | United Title |
Source: Public Records
Mortgage History
| Date | Status | Borrower | Loan Amount |
|---|---|---|---|
| Open | Tellez Maritza | $502,500 | |
| Previous Owner | Tellez Maritza | $396,000 | |
| Previous Owner | Tellez Victor | $116,950 |
Source: Public Records
Tax History Compared to Growth
Tax History
| Year | Tax Paid | Tax Assessment Tax Assessment Total Assessment is a certain percentage of the fair market value that is determined by local assessors to be the total taxable value of land and additions on the property. | Land | Improvement |
|---|---|---|---|---|
| 2025 | $7,077 | $652,800 | $229,500 | $423,300 |
| 2024 | $7,077 | $640,000 | $225,000 | $415,000 |
| 2023 | $2,165 | $195,516 | $58,769 | $136,747 |
| 2022 | $2,152 | $191,683 | $57,617 | $134,066 |
| 2021 | $2,110 | $187,924 | $56,487 | $131,437 |
| 2020 | $2,083 | $185,997 | $55,908 | $130,089 |
| 2019 | $2,047 | $182,350 | $54,812 | $127,538 |
| 2018 | $2,002 | $178,774 | $53,737 | $125,037 |
| 2017 | $1,967 | $175,268 | $52,683 | $122,585 |
| 2016 | $1,839 | $171,831 | $51,650 | $120,181 |
| 2015 | $1,802 | $169,250 | $50,874 | $118,376 |
| 2014 | $1,767 | $165,934 | $49,877 | $116,057 |
Source: Public Records
Map
Nearby Homes
- 12936 Cambridge Ct
- 13014 Bermuda Ave
- 12689 Cypress Ave
- 6061 Barbara St
- 6441 Susana St
- 6542 Hamilton St
- 12811 Oaks Ave
- 6031 Rosa Ct
- 12524 Ross Ave
- 13022 Cypress Ave
- 5925 Riverside Dr Unit 12
- 13006 Falcon Place
- 6630 Mogano Dr
- 12947 Robin Ln
- 12951 Red Cedar Way
- 6648 Riverside Dr Unit 3
- 12796 17th St
- 12321 Gardenia Place
- 6016 Harrison St
- 6766 Foxcroft Ct
- 6261 Serene Ct
- 6249 Serene Ct
- 6264 Verdugo Ave
- 6276 Verdugo Ave
- 6285 Serene Ct
- 6237 Serene Ct
- 6240 Verdugo Ave
- 6262 Serene Ct
- 6250 Serene Ct
- 6288 Verdugo Ave
- 6274 Serene Ct
- 6248 Serene Ct
- 6238 Verdugo Ave
- 6225 Serene Ct
- 6297 Serene Ct
- 6286 Serene Ct
- 6236 Serene Ct
- 6294 Verdugo Ave
- 6226 Verdugo Ave
- 6259 Lee Ct