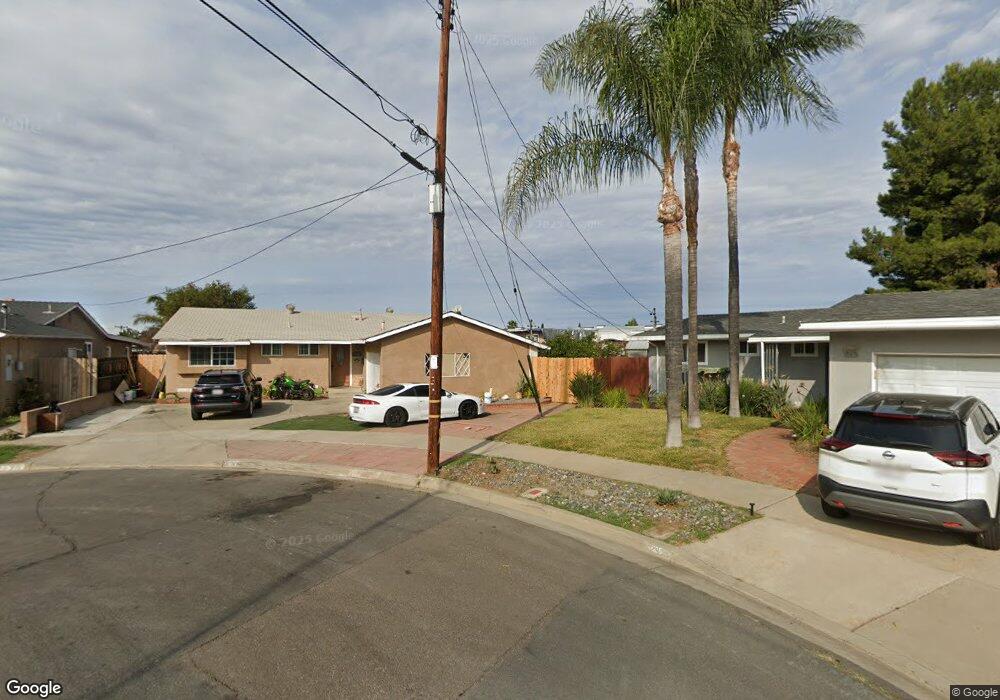
626 Bison Ct El Cajon, CA 92019
Estimated Value: $735,000 - $760,000
3
Beds
2
Baths
1,327
Sq Ft
$565/Sq Ft
Est. Value
About This Home
This home is located at 626 Bison Ct, El Cajon, CA 92019 and is currently estimated at $750,000, approximately $565 per square foot. 626 Bison Ct is a home located in San Diego County with nearby schools including Lexington Elementary School, Montgomery Middle School, and El Cajon Valley High School.
Ownership History
Date
Name
Owned For
Owner Type
Purchase Details
Closed on
Apr 24, 2006
Sold by
Gerlach Terry J and Gerlach Scott Andrew
Bought by
Smith Yolanda Razo
Current Estimated Value
Home Financials for this Owner
Home Financials are based on the most recent Mortgage that was taken out on this home.
Original Mortgage
$92,800
Interest Rate
6.09%
Mortgage Type
Stand Alone Second
Purchase Details
Closed on
Dec 5, 2003
Sold by
Gerlach Terry J
Bought by
Gerlach Terry J
Purchase Details
Closed on
Dec 20, 1994
Sold by
Gerlach John D
Bought by
Gerlach John
Create a Home Valuation Report for This Property
The Home Valuation Report is an in-depth analysis detailing your home's value as well as a comparison with similar homes in the area
Home Values in the Area
Average Home Value in this Area
Purchase History
| Date | Buyer | Sale Price | Title Company |
|---|---|---|---|
| Smith Yolanda Razo | $464,000 | First American Title | |
| Gerlach Terry J | -- | -- | |
| Gerlach John | -- | -- |
Source: Public Records
Mortgage History
| Date | Status | Borrower | Loan Amount |
|---|---|---|---|
| Closed | Smith Yolanda Razo | $92,800 | |
| Open | Smith Yolanda Razo | $371,200 |
Source: Public Records
Tax History Compared to Growth
Tax History
| Year | Tax Paid | Tax Assessment Tax Assessment Total Assessment is a certain percentage of the fair market value that is determined by local assessors to be the total taxable value of land and additions on the property. | Land | Improvement |
|---|---|---|---|---|
| 2025 | $8,771 | $634,041 | $409,941 | $224,100 |
| 2024 | $8,771 | $621,609 | $401,903 | $219,706 |
| 2023 | $8,714 | $609,422 | $394,023 | $215,399 |
| 2022 | $8,332 | $597,474 | $386,298 | $211,176 |
| 2021 | $7,780 | $550,000 | $309,000 | $241,000 |
| 2020 | $7,042 | $500,000 | $281,000 | $219,000 |
| 2019 | $5,787 | $480,000 | $270,000 | $210,000 |
| 2018 | $5,441 | $450,000 | $254,000 | $196,000 |
| 2017 | $4,988 | $410,000 | $232,000 | $178,000 |
| 2016 | $5,673 | $385,000 | $218,000 | $167,000 |
| 2015 | $4,204 | $350,000 | $199,000 | $151,000 |
| 2014 | $4,022 | $335,000 | $191,000 | $144,000 |
Source: Public Records
Map
Nearby Homes
- 398 Fordyce St
- 410 S 1st St Unit 157
- 410 S 1st St Unit 94
- 410 S 1st St Unit 156
- 410 S 1st St Unit 158
- 410 S 1st St Unit 35
- 410 S 1st St Unit 185
- 410 S 1st St Unit 199
- 410 S 1st St Unit 131
- 1110 Monterey Dr
- 1186 E Lexington Ave
- 1165 Decker St Unit 10
- 716 S 2nd St Unit 177
- 716 S 2nd St Unit 197
- 1170 Decker St Unit D
- 1164 Decker St Unit A
- 486 S Anza St
- 212 S 2nd St Unit 10
- 212 S 2nd St
- 212 S 2nd St Unit 54