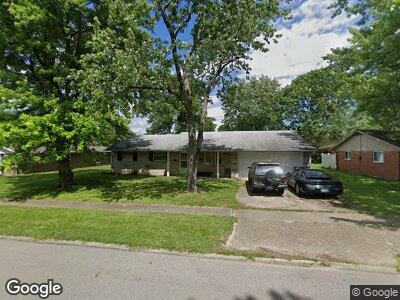
626 Franklin Ave Englewood, OH 45322
Estimated Value: $170,000 - $176,869
3
Beds
2
Baths
1,254
Sq Ft
$137/Sq Ft
Est. Value
About This Home
This home is located at 626 Franklin Ave, Englewood, OH 45322 and is currently estimated at $172,217, approximately $137 per square foot. 626 Franklin Ave is a home located in Montgomery County with nearby schools including Union Elementary School and Northmont High School.
Ownership History
Date
Name
Owned For
Owner Type
Purchase Details
Closed on
Jul 12, 2011
Sold by
Clayton Kimberly Rae and Bowling Lester
Bought by
Edgar John R
Current Estimated Value
Purchase Details
Closed on
Jan 7, 2011
Sold by
Estate Of Judy L Cecil
Bought by
Clayton Kimberly Rae and Edgar John R
Purchase Details
Closed on
Oct 25, 2010
Sold by
Edgar John R and Edgar John R
Bought by
Edgar John R
Create a Home Valuation Report for This Property
The Home Valuation Report is an in-depth analysis detailing your home's value as well as a comparison with similar homes in the area
Home Values in the Area
Average Home Value in this Area
Purchase History
| Date | Buyer | Sale Price | Title Company |
|---|---|---|---|
| Edgar John R | -- | None Available | |
| Clayton Kimberly Rae | -- | None Available | |
| Edgar John R | -- | None Available |
Source: Public Records
Tax History Compared to Growth
Tax History
| Year | Tax Paid | Tax Assessment Tax Assessment Total Assessment is a certain percentage of the fair market value that is determined by local assessors to be the total taxable value of land and additions on the property. | Land | Improvement |
|---|---|---|---|---|
| 2024 | $3,104 | $45,720 | $11,470 | $34,250 |
| 2023 | $3,104 | $45,720 | $11,470 | $34,250 |
| 2022 | $2,754 | $30,690 | $7,700 | $22,990 |
| 2021 | $2,701 | $30,690 | $7,700 | $22,990 |
| 2020 | $2,683 | $30,690 | $7,700 | $22,990 |
| 2019 | $2,555 | $26,030 | $7,700 | $18,330 |
| 2018 | $2,563 | $26,030 | $7,700 | $18,330 |
| 2017 | $2,420 | $26,030 | $7,700 | $18,330 |
| 2016 | $2,482 | $26,360 | $7,700 | $18,660 |
| 2015 | $2,317 | $26,360 | $7,700 | $18,660 |
| 2014 | $2,317 | $26,360 | $7,700 | $18,660 |
| 2012 | -- | $30,420 | $6,130 | $24,290 |
Source: Public Records
Map
Nearby Homes
- 200 Shaw Rd
- 147 Mccraw Dr
- 210 S San Bernardino Trail
- 308 S San Bernardino Trail
- 0 Phillipsburg Union Rd Unit 1027008
- 0 Phillipsburg Union Rd Unit 891267
- 144 Union Ridge Dr
- 107 Heckman Dr
- 111 Union Ridge Dr
- 125 Warner Dr
- 308 Lang Ct
- 115 Charles Place
- 132 Marrett Farm Rd
- 19 Laurelgrove Dr
- 110 S Montgomery St
- 119 Magdalena Dr
- 102 Margarets Run Ct
- 102 Peggys Path Ct
- 826 W Martindale Rd
- 115 S Main St
- 626 Franklin Ave
- 624 Franklin Ave
- 155 Mccraw Dr
- 644 Skyles Rd
- 153 Mccraw Dr
- 635 Franklin Ave
- 151 Mccraw Dr
- 642 Skyles Rd
- 637 Franklin Ave
- 648 Skyles Rd
- 622 Franklin Ave
- 639 Franklin Ave
- 149 Mccraw Dr
- 640 Skyles Rd
- 172 Mccraw Dr
- 170 Mccraw Dr
- 641 Skyles Rd
- 641 Franklin Ave
- 168 Mccraw Dr
- 645 Skyles Rd