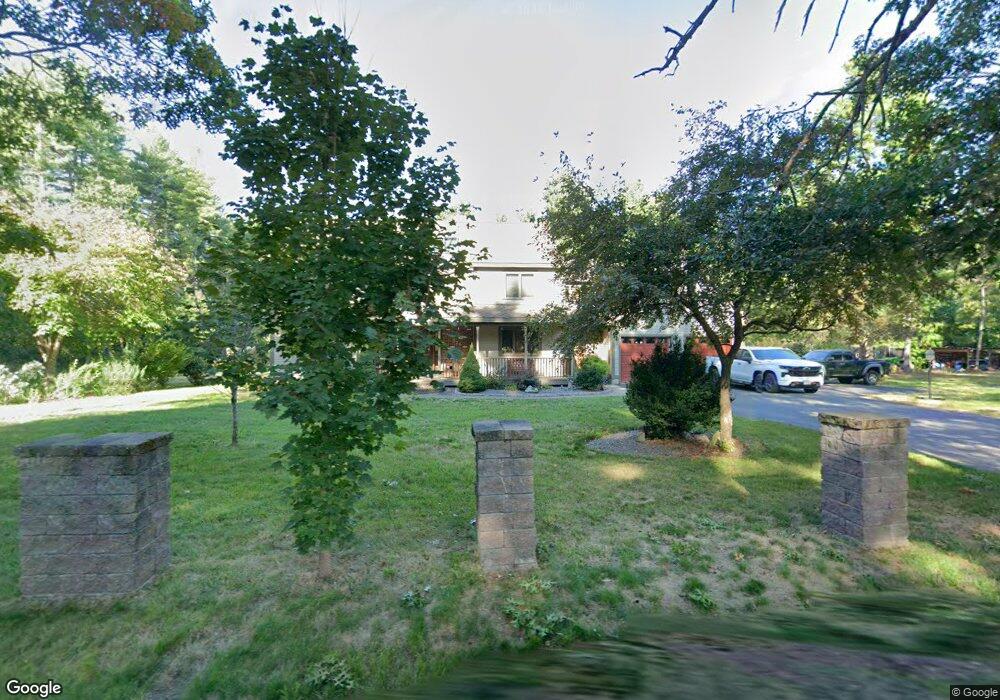
626 Hollis St Dunstable, MA 01827
Estimated Value: $774,000 - $956,000
3
Beds
3
Baths
3,472
Sq Ft
$250/Sq Ft
Est. Value
About This Home
This home is located at 626 Hollis St, Dunstable, MA 01827 and is currently estimated at $869,216, approximately $250 per square foot. 626 Hollis St is a home located in Middlesex County with nearby schools including Groton Dunstable Regional High School, MicroSociety Academy Charter School, and 2nd Nature Academy.
Ownership History
Date
Name
Owned For
Owner Type
Purchase Details
Closed on
Oct 29, 2025
Sold by
Smith Annette M
Bought by
Kab Ft and Smith
Current Estimated Value
Purchase Details
Closed on
Feb 12, 1991
Sold by
Parker David A and Parker Annette M
Bought by
Parker Annette M
Home Financials for this Owner
Home Financials are based on the most recent Mortgage that was taken out on this home.
Original Mortgage
$104,000
Interest Rate
9.57%
Mortgage Type
Purchase Money Mortgage
Create a Home Valuation Report for This Property
The Home Valuation Report is an in-depth analysis detailing your home's value as well as a comparison with similar homes in the area
Home Values in the Area
Average Home Value in this Area
Purchase History
| Date | Buyer | Sale Price | Title Company |
|---|---|---|---|
| Kab Ft | -- | -- | |
| Parker Annette M | $42,500 | -- |
Source: Public Records
Mortgage History
| Date | Status | Borrower | Loan Amount |
|---|---|---|---|
| Previous Owner | Parker Annette M | $50,000 | |
| Previous Owner | Parker Annette M | $10,000 | |
| Previous Owner | Parker Annette M | $104,000 |
Source: Public Records
Tax History Compared to Growth
Tax History
| Year | Tax Paid | Tax Assessment Tax Assessment Total Assessment is a certain percentage of the fair market value that is determined by local assessors to be the total taxable value of land and additions on the property. | Land | Improvement |
|---|---|---|---|---|
| 2025 | $10,110 | $735,300 | $221,000 | $514,300 |
| 2024 | $9,980 | $714,900 | $212,400 | $502,500 |
| 2023 | $9,973 | $666,200 | $212,400 | $453,800 |
| 2022 | $9,510 | $623,600 | $212,400 | $411,200 |
| 2021 | $13,743 | $563,600 | $191,900 | $371,700 |
| 2020 | $9,363 | $556,000 | $191,900 | $364,100 |
| 2019 | $9,131 | $535,200 | $191,900 | $343,300 |
| 2018 | $9,107 | $519,200 | $190,900 | $328,300 |
| 2017 | $2,850 | $521,800 | $190,900 | $330,900 |
| 2016 | $8,674 | $524,100 | $190,900 | $333,200 |
| 2015 | $8,447 | $504,900 | $159,900 | $345,000 |
| 2014 | $7,962 | $504,900 | $159,900 | $345,000 |
Source: Public Records
Map
Nearby Homes