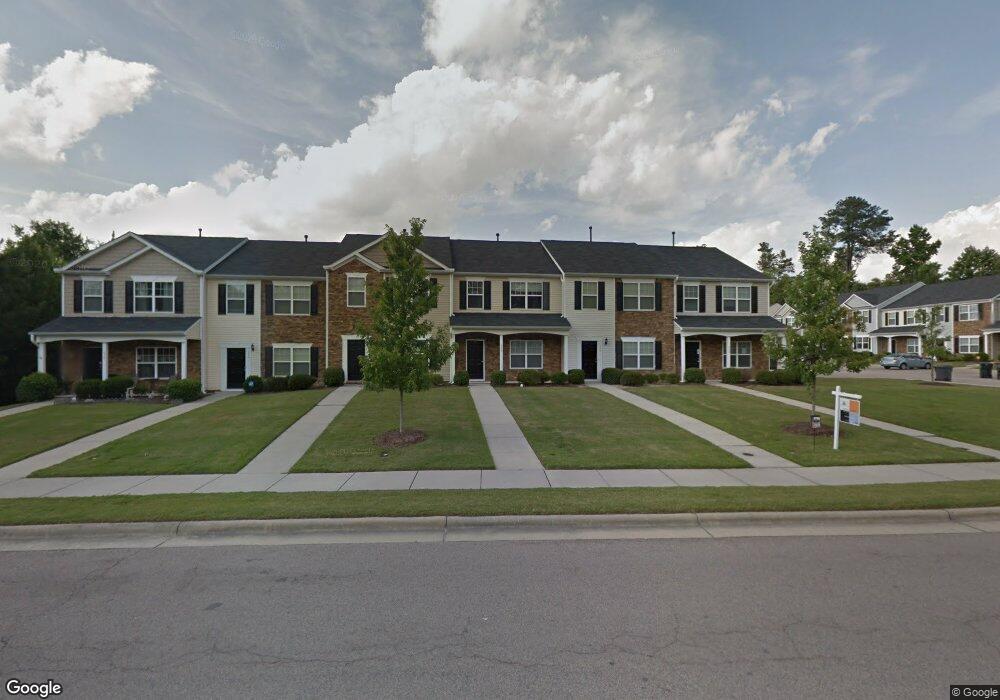
626 Laurens Way Knightdale, NC 27545
Estimated Value: $264,000 - $278,000
3
Beds
3
Baths
1,520
Sq Ft
$178/Sq Ft
Est. Value
About This Home
This home is located at 626 Laurens Way, Knightdale, NC 27545 and is currently estimated at $271,249, approximately $178 per square foot. 626 Laurens Way is a home located in Wake County with nearby schools including Knightdale Elementary School, Neuse River Middle School, and Knightdale High.
Ownership History
Date
Name
Owned For
Owner Type
Purchase Details
Closed on
Apr 26, 2018
Sold by
Mcroberts Joseph and Mcroberts Erika
Bought by
Jackson Jill P
Current Estimated Value
Home Financials for this Owner
Home Financials are based on the most recent Mortgage that was taken out on this home.
Original Mortgage
$160,001
Outstanding Balance
$137,893
Interest Rate
4.44%
Mortgage Type
FHA
Estimated Equity
$133,356
Purchase Details
Closed on
Apr 15, 2008
Sold by
D R Horton Inc
Bought by
Mcroberts Joseph A and Mcroberts Erika J
Home Financials for this Owner
Home Financials are based on the most recent Mortgage that was taken out on this home.
Original Mortgage
$126,875
Interest Rate
6.22%
Mortgage Type
FHA
Purchase Details
Closed on
Sep 26, 2007
Sold by
D R Horton Inc
Bought by
Garner Charles A
Home Financials for this Owner
Home Financials are based on the most recent Mortgage that was taken out on this home.
Original Mortgage
$135,916
Interest Rate
6.57%
Mortgage Type
VA
Create a Home Valuation Report for This Property
The Home Valuation Report is an in-depth analysis detailing your home's value as well as a comparison with similar homes in the area
Home Values in the Area
Average Home Value in this Area
Purchase History
| Date | Buyer | Sale Price | Title Company |
|---|---|---|---|
| Jackson Jill P | $163,000 | None Available | |
| Mcroberts Joseph A | $129,500 | None Available | |
| Garner Charles A | $133,500 | None Available |
Source: Public Records
Mortgage History
| Date | Status | Borrower | Loan Amount |
|---|---|---|---|
| Open | Jackson Jill P | $160,001 | |
| Previous Owner | Mcroberts Joseph A | $126,875 | |
| Previous Owner | Garner Charles A | $135,916 |
Source: Public Records
Tax History Compared to Growth
Tax History
| Year | Tax Paid | Tax Assessment Tax Assessment Total Assessment is a certain percentage of the fair market value that is determined by local assessors to be the total taxable value of land and additions on the property. | Land | Improvement |
|---|---|---|---|---|
| 2025 | $2,658 | $275,586 | $55,000 | $220,586 |
| 2024 | $2,648 | $275,586 | $55,000 | $220,586 |
| 2023 | $1,981 | $177,164 | $34,000 | $143,164 |
| 2022 | $1,915 | $177,164 | $34,000 | $143,164 |
| 2021 | $1,827 | $177,164 | $34,000 | $143,164 |
| 2020 | $1,827 | $177,164 | $34,000 | $143,164 |
| 2019 | $1,460 | $125,113 | $22,000 | $103,113 |
| 2018 | $1,377 | $125,113 | $22,000 | $103,113 |
| 2017 | $1,327 | $125,113 | $22,000 | $103,113 |
| 2016 | $1,309 | $125,113 | $22,000 | $103,113 |
| 2015 | $1,390 | $131,153 | $22,000 | $109,153 |
| 2014 | -- | $131,153 | $22,000 | $109,153 |
Source: Public Records
Map
Nearby Homes
- 619 Laurens Way
- 506 Sternwheel Way
- 1456 Jay Rd
- 1466 Jay Rd
- 1463 Jay Rd
- 1452 Jay Rd
- 444 Haywood Glen Dr
- 1580 Goldfinch Perch Ln
- 1444 Jay Rd
- 1728 Goldfinch Perch Ln
- 1440 Jay Rd
- 1704 Goldfinch Perch Ln
- 1442 Jay Rd
- 1712 Goldfinch Perch Ln
- 1448 Jay Rd
- 1504 Wader Cir
- 1512 Wader Cir
- 1516 Wader Cir
- 1500 Wader Cir
- 1508 Wader Cir
- 624 Laurens Way
- 622 Laurens Way
- 628 Laurens Way
- 620 Laurens Way
- 630 Laurens Way
- 201 Tallula Ln
- 201 Tallula Ln Unit (UnitID 12745628)
- 203 Tallula Ln
- 627 Laurens Way
- 205 Tallula Ln
- 625 Laurens Way
- 102 Tallula Ln
- 623 Laurens Way
- 104 Tallula Ln
- 106 Tallula Ln
- 621 Laurens Way
- 108 Tallula Ln
- 110 Tallula Ln
- 112 Tallula Ln
- 503 Sternwheel Way