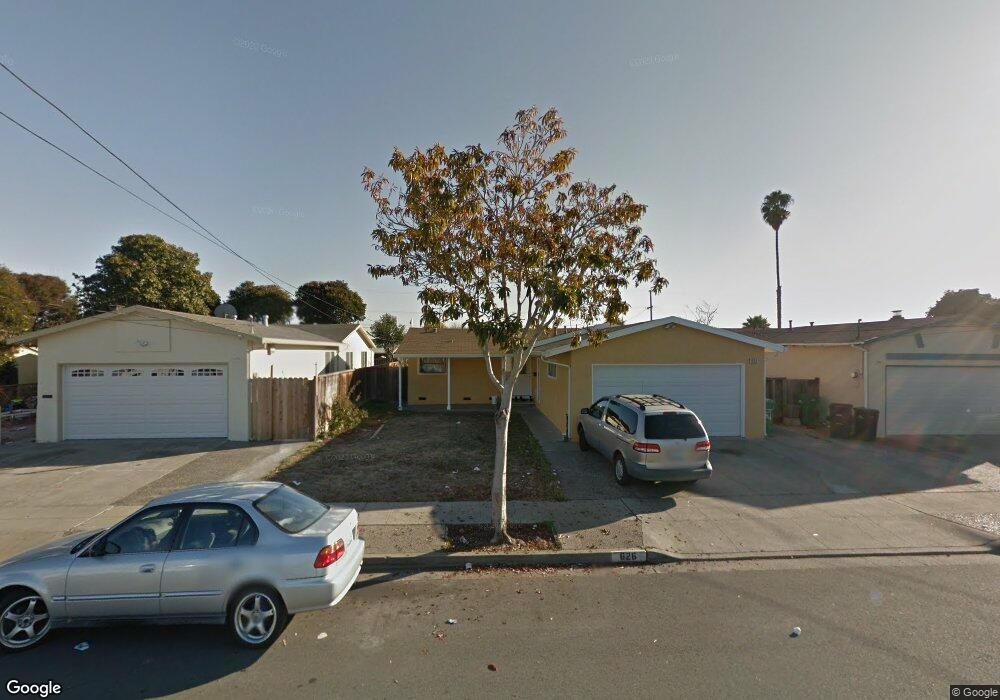
626 Minerva St Hayward, CA 94544
Tennyson-Alquire NeighborhoodEstimated Value: $896,000 - $983,911
3
Beds
2
Baths
1,126
Sq Ft
$839/Sq Ft
Est. Value
About This Home
This home is located at 626 Minerva St, Hayward, CA 94544 and is currently estimated at $944,228, approximately $838 per square foot. 626 Minerva St is a home located in Alameda County with nearby schools including Ruus Elementary School, Cesar Chavez Middle School, and Tennyson High School.
Ownership History
Date
Name
Owned For
Owner Type
Purchase Details
Closed on
Dec 11, 2020
Sold by
Singh Buta
Bought by
Singh Buta and Kaur Hardeep
Current Estimated Value
Home Financials for this Owner
Home Financials are based on the most recent Mortgage that was taken out on this home.
Original Mortgage
$240,494
Outstanding Balance
$214,493
Interest Rate
2.8%
Mortgage Type
New Conventional
Estimated Equity
$729,735
Purchase Details
Closed on
Jul 24, 2013
Sold by
Kaur Hardeep
Bought by
Singh Buta
Home Financials for this Owner
Home Financials are based on the most recent Mortgage that was taken out on this home.
Original Mortgage
$320,000
Interest Rate
3.92%
Mortgage Type
New Conventional
Purchase Details
Closed on
Apr 3, 2013
Sold by
Santacruz Arturo R and Santacruz Margarita
Bought by
Rattan Praveen
Home Financials for this Owner
Home Financials are based on the most recent Mortgage that was taken out on this home.
Original Mortgage
$256,500
Interest Rate
3.54%
Mortgage Type
New Conventional
Purchase Details
Closed on
Aug 9, 2006
Sold by
Santacruz Arturo and Santacruz Rodrigo
Bought by
Santacruz Arturo R and Santacruz Margarita
Home Financials for this Owner
Home Financials are based on the most recent Mortgage that was taken out on this home.
Original Mortgage
$424,000
Interest Rate
7.5%
Mortgage Type
Negative Amortization
Purchase Details
Closed on
Jul 7, 2004
Sold by
Almond Thomas M and Thomas M Almond Family Trust
Bought by
Santacruz Arthur and Santacruz Rodrigo
Home Financials for this Owner
Home Financials are based on the most recent Mortgage that was taken out on this home.
Original Mortgage
$333,600
Interest Rate
6.27%
Mortgage Type
Purchase Money Mortgage
Purchase Details
Closed on
Jun 9, 2004
Sold by
Santacruz Anaelba L
Bought by
Santacruz Rodrigo A
Home Financials for this Owner
Home Financials are based on the most recent Mortgage that was taken out on this home.
Original Mortgage
$333,600
Interest Rate
6.27%
Mortgage Type
Purchase Money Mortgage
Purchase Details
Closed on
Feb 28, 2002
Sold by
Almond Thomas M
Bought by
Almond Thomas M and Thomas M Almond Family Trust
Purchase Details
Closed on
Nov 22, 2000
Sold by
Lazano Danny A and Lazano Roselle M
Bought by
Almond Thomas M
Home Financials for this Owner
Home Financials are based on the most recent Mortgage that was taken out on this home.
Original Mortgage
$100,000
Interest Rate
7.86%
Create a Home Valuation Report for This Property
The Home Valuation Report is an in-depth analysis detailing your home's value as well as a comparison with similar homes in the area
Home Values in the Area
Average Home Value in this Area
Purchase History
| Date | Buyer | Sale Price | Title Company |
|---|---|---|---|
| Singh Buta | -- | First American Title Company | |
| Singh Buta | -- | Orange Coast Title Company | |
| Singh Buta | $400,000 | Orange Coast Title Company O | |
| Rattan Praveen | $270,000 | North American Title Company | |
| Santacruz Arturo R | -- | Transnation Title Southland | |
| Santacruz Rodrigo | -- | Transnation Title Southland | |
| Santacruz Arthur | $417,000 | Chicago Title Co | |
| Santacruz Rodrigo A | -- | Chicago Title Co | |
| Santacruz Arturo R | -- | Chicago Title Co | |
| Almond Thomas M | -- | -- | |
| Almond Thomas M | $295,000 | Chicago Title Co |
Source: Public Records
Mortgage History
| Date | Status | Borrower | Loan Amount |
|---|---|---|---|
| Open | Singh Buta | $240,494 | |
| Closed | Singh Buta | $320,000 | |
| Previous Owner | Rattan Praveen | $256,500 | |
| Previous Owner | Santacruz Arturo R | $424,000 | |
| Previous Owner | Santacruz Arthur | $333,600 | |
| Previous Owner | Santacruz Arturo R | $83,400 | |
| Previous Owner | Almond Thomas M | $100,000 |
Source: Public Records
Tax History
| Year | Tax Paid | Tax Assessment Tax Assessment Total Assessment is a certain percentage of the fair market value that is determined by local assessors to be the total taxable value of land and additions on the property. | Land | Improvement |
|---|---|---|---|---|
| 2025 | $7,764 | $636,323 | $147,097 | $496,226 |
| 2024 | $7,764 | $623,711 | $144,213 | $486,498 |
| 2023 | $5,898 | $471,287 | $141,386 | $329,901 |
| 2022 | $5,783 | $455,047 | $138,614 | $323,433 |
| 2021 | $5,735 | $445,991 | $135,897 | $317,094 |
| 2020 | $5,671 | $448,347 | $134,504 | $313,843 |
| 2019 | $5,715 | $439,560 | $131,868 | $307,692 |
| 2018 | $5,365 | $430,943 | $129,283 | $301,660 |
| 2017 | $5,241 | $422,495 | $126,748 | $295,747 |
| 2016 | $4,939 | $414,211 | $124,263 | $289,948 |
| 2015 | $4,840 | $407,991 | $122,397 | $285,594 |
| 2014 | $4,768 | $400,000 | $120,000 | $280,000 |
Source: Public Records
Map
Nearby Homes
- 139 Mars Ave Unit 139
- 28538 Huntwood Ave
- 29255 Harpoon Way
- 29026 Hillview St
- 27906 Thackeray Ave
- 29273 Nantucket Way
- 28315 Rochelle Ave
- 29131 Delgado Rd
- 933 New England Village Dr
- 29286 Whalebone Way
- 29341 Sandburg Way
- 29133 De la Cruz Rd
- 27781 Dickens Ave
- 29043 Windemere Rd
- 29372 Providence Way Unit 111
- 27777 Pistachio Ct
- 27773 Pistachio Ct
- 29424 Providence Way
- 29428 Middleborough Way
- 1587 de Lemos Ave
Your Personal Tour Guide
Ask me questions while you tour the home.