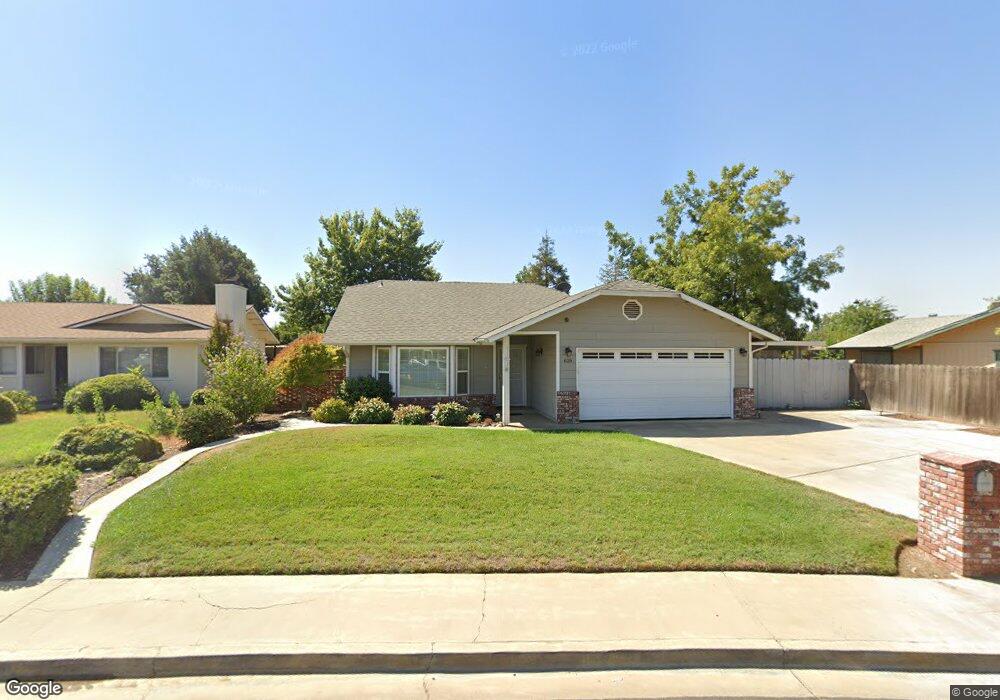
626 Moore Cir Exeter, CA 93221
Estimated Value: $341,404 - $403,000
3
Beds
2
Baths
1,200
Sq Ft
$311/Sq Ft
Est. Value
About This Home
This home is located at 626 Moore Cir, Exeter, CA 93221 and is currently estimated at $372,851, approximately $310 per square foot. 626 Moore Cir is a home located in Tulare County with nearby schools including Sierra View Junior Academy.
Ownership History
Date
Name
Owned For
Owner Type
Purchase Details
Closed on
May 28, 2024
Sold by
Lopez Frances A
Bought by
Lopez Family Revocable Trust and Lopez
Current Estimated Value
Purchase Details
Closed on
Apr 18, 2024
Sold by
Clara B Morillo 2014 Living Trust and Lopez Frances
Bought by
Lopez Frances A
Purchase Details
Closed on
Feb 19, 2014
Sold by
Morillo Clara B
Bought by
Morillo Clara B and Clara B Morillo 2013 Living Trust
Purchase Details
Closed on
May 15, 2002
Sold by
Templeton Emma Jean
Bought by
Morillo Clara B
Home Financials for this Owner
Home Financials are based on the most recent Mortgage that was taken out on this home.
Original Mortgage
$60,000
Interest Rate
6.74%
Purchase Details
Closed on
Jan 3, 1996
Sold by
Templeton Emma Jean
Bought by
Templeton Emma Jean
Create a Home Valuation Report for This Property
The Home Valuation Report is an in-depth analysis detailing your home's value as well as a comparison with similar homes in the area
Home Values in the Area
Average Home Value in this Area
Purchase History
| Date | Buyer | Sale Price | Title Company |
|---|---|---|---|
| Lopez Family Revocable Trust | -- | None Listed On Document | |
| Lopez Frances A | -- | None Listed On Document | |
| Morillo Clara B | -- | None Available | |
| Morillo Clara B | $110,000 | Cuesta Title | |
| Templeton Emma Jean | -- | -- |
Source: Public Records
Mortgage History
| Date | Status | Borrower | Loan Amount |
|---|---|---|---|
| Previous Owner | Morillo Clara B | $60,000 |
Source: Public Records
Tax History
| Year | Tax Paid | Tax Assessment Tax Assessment Total Assessment is a certain percentage of the fair market value that is determined by local assessors to be the total taxable value of land and additions on the property. | Land | Improvement |
|---|---|---|---|---|
| 2025 | $1,704 | $326,400 | $91,800 | $234,600 |
| 2024 | $1,704 | $159,324 | $43,452 | $115,872 |
| 2023 | $1,659 | $156,200 | $42,600 | $113,600 |
| 2022 | $1,623 | $153,138 | $41,765 | $111,373 |
| 2021 | $1,610 | $150,135 | $40,946 | $109,189 |
| 2020 | $1,590 | $148,595 | $40,526 | $108,069 |
| 2019 | $1,542 | $145,681 | $39,731 | $105,950 |
| 2018 | $1,471 | $142,825 | $38,952 | $103,873 |
| 2017 | $1,454 | $140,024 | $38,188 | $101,836 |
| 2016 | $1,397 | $137,278 | $37,439 | $99,839 |
| 2015 | $1,381 | $135,216 | $36,877 | $98,339 |
| 2014 | $1,381 | $132,568 | $36,155 | $96,413 |
Source: Public Records
Map
Nearby Homes
- 618 Birdsong Ct
- 509 S Orange Ave
- 729 St Thomas Ct
- 525 Cosart Ct
- 605 Stanley St
- 264 S Orange Ave
- Ave 276 Avenue 276
- 107 Ruth St
- 457 W Maple St
- 447 W Maple St
- 103 E Firebaugh Ave
- 137 N H St
- 570 Little Ln
- 307 N Orange Ave
- 314 N Albert Ave Unit 132
- 314 N Albert Ave Unit 39
- 314 N Albert Ave Unit 1
- 314 N Albert Ave Unit 42
- 314 N Albert Ave Unit 73
- 314 N Albert Ave Unit 101
Your Personal Tour Guide
Ask me questions while you tour the home.