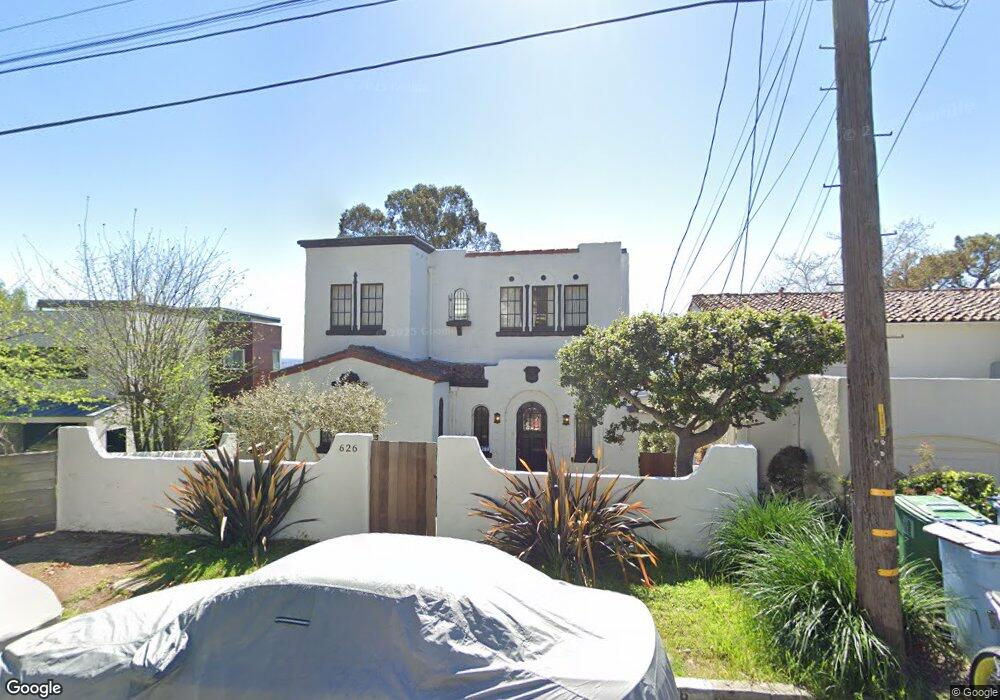
626 San Luis Rd Berkeley, CA 94707
Estimated Value: $2,286,000 - $3,413,000
5
Beds
3
Baths
2,552
Sq Ft
$1,035/Sq Ft
Est. Value
About This Home
This home is located at 626 San Luis Rd, Berkeley, CA 94707 and is currently estimated at $2,642,307, approximately $1,035 per square foot. 626 San Luis Rd is a home located in Alameda County with nearby schools including Thousand Oaks Elementary School, Berkeley Arts Magnet at Whittier School, and Ruth Acty Elementary.
Ownership History
Date
Name
Owned For
Owner Type
Purchase Details
Closed on
Oct 26, 2006
Sold by
Olivier Pierre and De Metz Olivier Laure M
Bought by
Olivier Pierre and Demetz Olivier Laure
Current Estimated Value
Purchase Details
Closed on
Feb 11, 2003
Sold by
Desilva Phoebe and The Lewis Meyers Family Trust
Bought by
Olivier Pierre and Demetz Olivier Laure
Home Financials for this Owner
Home Financials are based on the most recent Mortgage that was taken out on this home.
Original Mortgage
$650,000
Outstanding Balance
$269,224
Interest Rate
5.5%
Mortgage Type
Purchase Money Mortgage
Estimated Equity
$2,373,083
Purchase Details
Closed on
Oct 25, 2002
Sold by
Meyers Lewis
Bought by
Desilva Phoebe and The Lewis Meyers Family Trust
Create a Home Valuation Report for This Property
The Home Valuation Report is an in-depth analysis detailing your home's value as well as a comparison with similar homes in the area
Home Values in the Area
Average Home Value in this Area
Purchase History
| Date | Buyer | Sale Price | Title Company |
|---|---|---|---|
| Olivier Pierre | -- | None Available | |
| Olivier Pierre | $850,000 | First American Title Company | |
| Desilva Phoebe | -- | -- |
Source: Public Records
Mortgage History
| Date | Status | Borrower | Loan Amount |
|---|---|---|---|
| Open | Olivier Pierre | $650,000 | |
| Closed | Olivier Pierre | $114,750 |
Source: Public Records
Tax History
| Year | Tax Paid | Tax Assessment Tax Assessment Total Assessment is a certain percentage of the fair market value that is determined by local assessors to be the total taxable value of land and additions on the property. | Land | Improvement |
|---|---|---|---|---|
| 2025 | $22,707 | $1,370,193 | $369,291 | $1,000,902 |
| 2024 | $22,707 | $1,343,332 | $362,051 | $981,281 |
| 2023 | $22,169 | $1,317,000 | $354,954 | $962,046 |
| 2022 | $21,684 | $1,291,180 | $347,995 | $943,185 |
| 2021 | $21,723 | $1,265,871 | $341,174 | $924,697 |
| 2020 | $20,493 | $1,252,899 | $337,678 | $915,221 |
| 2019 | $19,614 | $1,228,338 | $331,058 | $897,280 |
| 2018 | $19,259 | $1,204,260 | $324,569 | $879,691 |
| 2017 | $18,607 | $1,180,653 | $318,206 | $862,447 |
| 2016 | $17,959 | $1,157,510 | $311,969 | $845,541 |
| 2015 | $17,704 | $1,140,130 | $307,285 | $832,845 |
| 2014 | $17,499 | $1,117,801 | $301,267 | $816,534 |
Source: Public Records
Map
Nearby Homes
- 589 San Luis Rd
- 483 Boynton Ave
- 450 Vermont Ave
- 765 San Diego Rd
- 380 Vermont Ave
- 470 Spruce St
- 1983 Yosemite Rd
- 614 Cragmont Ave
- 758 Spruce St
- 813 San Diego Rd
- 410 Grizzly Peak Blvd
- 777 Cragmont Ave
- 606 Grizzly Peak Blvd
- 1858 San Lorenzo Ave
- 491 Vincente Ave
- 543 Grizzly Peak Blvd
- 255 Stanford Ave
- 290 Colgate Ave
- 249 Trinity Ave
- 201 Amherst Ave
- 622 San Luis Rd
- 632 San Luis Rd
- 1965 San Antonio Ave
- 618 San Luis Rd
- 1959 San Antonio Ave
- 638 San Luis Rd
- 612 San Luis Rd
- 623 San Luis Rd
- 625 San Luis Rd
- 644 San Luis Rd
- 1984 San Antonio Ave
- 621 San Luis Rd
- 633 San Luis Rd
- 1945 San Antonio Ave
- 639 San Luis Rd
- 615 San Luis Rd
- 652 San Luis Rd
- 608 San Luis Rd
- 643 San Luis Rd
- 611 San Luis Rd
Your Personal Tour Guide
Ask me questions while you tour the home.