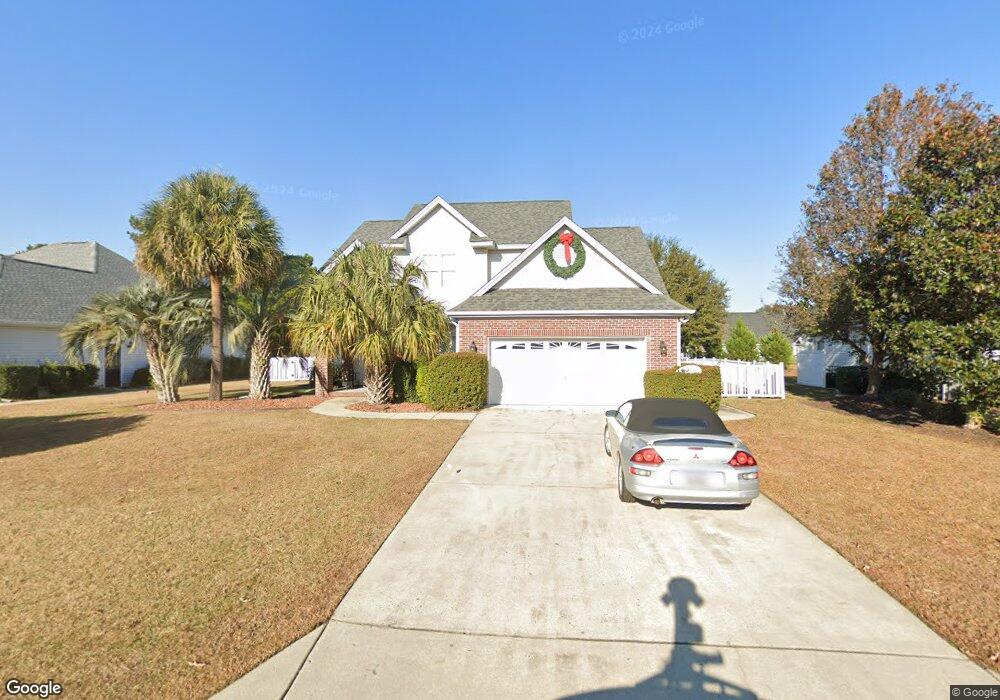
626 Slash Pine Ct Myrtle Beach, SC 29579
Estimated Value: $338,783 - $407,000
4
Beds
2
Baths
2,074
Sq Ft
$179/Sq Ft
Est. Value
About This Home
This home is located at 626 Slash Pine Ct, Myrtle Beach, SC 29579 and is currently estimated at $370,446, approximately $178 per square foot. 626 Slash Pine Ct is a home located in Horry County with nearby schools including Carolina Forest Elementary School, Ten Oaks Middle, and Carolina Forest High School.
Ownership History
Date
Name
Owned For
Owner Type
Purchase Details
Closed on
May 21, 2001
Sold by
Larose John R
Bought by
Leone Larose Jana B
Current Estimated Value
Home Financials for this Owner
Home Financials are based on the most recent Mortgage that was taken out on this home.
Original Mortgage
$164,000
Outstanding Balance
$61,600
Interest Rate
7.11%
Mortgage Type
Unknown
Estimated Equity
$308,846
Purchase Details
Closed on
Jun 4, 1999
Sold by
Horizon Development Inc
Bought by
Larose John R and Leone Larose Jana B
Home Financials for this Owner
Home Financials are based on the most recent Mortgage that was taken out on this home.
Original Mortgage
$60,000
Interest Rate
7.04%
Mortgage Type
Unknown
Purchase Details
Closed on
May 28, 1998
Sold by
Springlake Property Owners Assn Inc
Bought by
Horizon Development Inc
Home Financials for this Owner
Home Financials are based on the most recent Mortgage that was taken out on this home.
Original Mortgage
$175,000
Interest Rate
7.23%
Mortgage Type
Construction
Create a Home Valuation Report for This Property
The Home Valuation Report is an in-depth analysis detailing your home's value as well as a comparison with similar homes in the area
Home Values in the Area
Average Home Value in this Area
Purchase History
| Date | Buyer | Sale Price | Title Company |
|---|---|---|---|
| Leone Larose Jana B | -- | -- | |
| Larose John R | $203,900 | -- | |
| Horizon Development Inc | -- | -- | |
| Horizon Development Inc | $33,210 | -- |
Source: Public Records
Mortgage History
| Date | Status | Borrower | Loan Amount |
|---|---|---|---|
| Open | Leone Larose Jana B | $164,000 | |
| Previous Owner | Larose John R | $60,000 | |
| Previous Owner | Horizon Development Inc | $175,000 |
Source: Public Records
Tax History Compared to Growth
Tax History
| Year | Tax Paid | Tax Assessment Tax Assessment Total Assessment is a certain percentage of the fair market value that is determined by local assessors to be the total taxable value of land and additions on the property. | Land | Improvement |
|---|---|---|---|---|
| 2024 | $3,271 | $21,290 | $8,296 | $12,994 |
| 2023 | $3,271 | $13,762 | $2,785 | $10,977 |
| 2021 | $3,016 | $15,874 | $3,424 | $12,450 |
| 2020 | $2,867 | $15,874 | $3,424 | $12,450 |
| 2019 | $2,867 | $15,874 | $3,424 | $12,450 |
| 2018 | $2,590 | $11,967 | $2,409 | $9,558 |
| 2017 | $2,575 | $11,967 | $2,409 | $9,558 |
| 2016 | -- | $11,967 | $2,409 | $9,558 |
| 2015 | $2,575 | $11,967 | $2,409 | $9,558 |
| 2014 | $2,489 | $11,967 | $2,409 | $9,558 |
Source: Public Records
Map
Nearby Homes
- 629 Slash Pine Ct
- 490 Blackberry Ln
- 463 Springlake Dr
- 505 Quincy Hall Dr
- 553 Linton Park Rd
- 523 Stonemason Dr
- 2384 Covington Dr
- 546 Stonemason Dr
- 105 Ashley Park Dr Unit 2-E
- 422 Megan Ann Ln
- 620 Ellsworth Ct
- 129 Ashley Park Dr Unit 7 C
- 4818 Harvest Dr
- 4800 New Haven Ct
- 6019 Quinn Rd Unit MB
- 4905 Britewater Ct Unit 202
- 801 Celene Ct
- 4907 Britewater Ct Unit 102
- 4826 Keel Ct
- 4913 Twin Pond Ct Unit 202
- 628 Slash Pine Ct Unit MB
- 624 Slash Pine Ct
- 727 Churchill Downs Dr
- 635 Slash Pine Ct
- 725 Churchill Downs Dr
- 729 Churchill Downs Dr
- 729 Churchill Downs Dr Unit Lot 189 Spring Lake
- 630 Slash Pine Ct
- 627 Slash Pine Ct
- 625 Slash Pine Ct
- 731 Churchill Downs Dr
- 716 Morning Star Ct
- 631 Slash Pine Ct Unit CR
- 621 Woodbine Ct
- 633 Slash Pine Ct
- 618 Woodbine Ct Unit MB
- 730 Churchill Downs Dr
- 733 Churchill Downs Dr
- 726 Churchill Downs Dr
- 732 Churchill Downs Dr