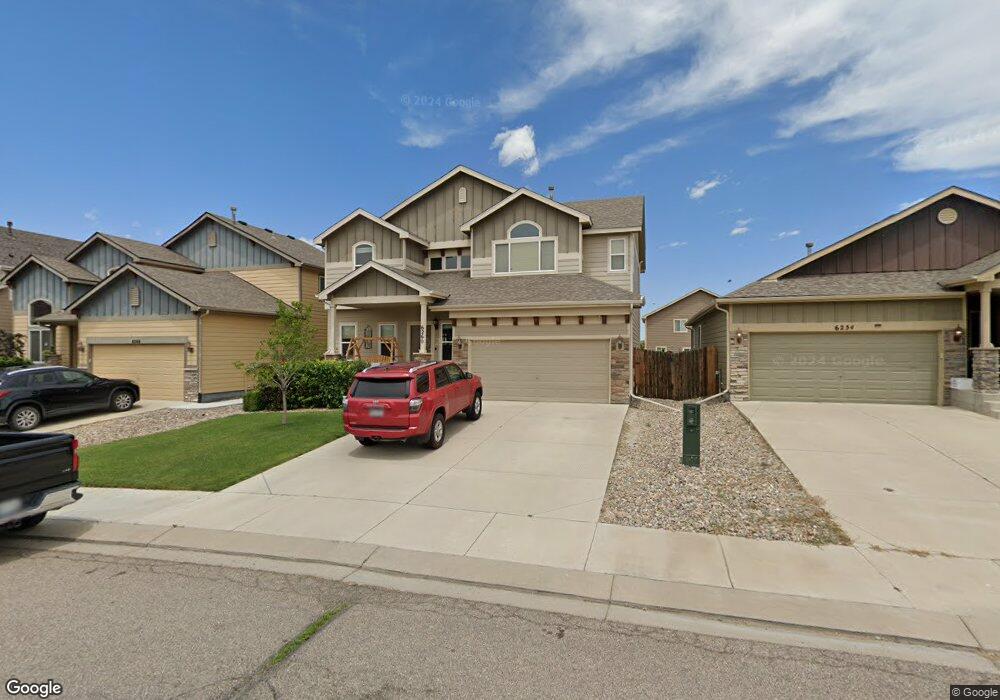
6260 Bearcat Loop Colorado Springs, CO 80925
Widefield NeighborhoodEstimated Value: $492,055 - $523,000
6
Beds
4
Baths
2,188
Sq Ft
$233/Sq Ft
Est. Value
About This Home
This home is located at 6260 Bearcat Loop, Colorado Springs, CO 80925 and is currently estimated at $510,514, approximately $233 per square foot. 6260 Bearcat Loop is a home with nearby schools including Grand Mountain School, Widefield High School, and Valley Christian Academy.
Ownership History
Date
Name
Owned For
Owner Type
Purchase Details
Closed on
Sep 23, 2019
Sold by
Dent James Q
Bought by
Perkins Caleb Ross and Perkins Kristina Lorraine
Current Estimated Value
Home Financials for this Owner
Home Financials are based on the most recent Mortgage that was taken out on this home.
Original Mortgage
$300,900
Outstanding Balance
$263,565
Interest Rate
3.6%
Mortgage Type
New Conventional
Estimated Equity
$246,949
Purchase Details
Closed on
Jan 19, 2017
Sold by
Paso El
Bought by
Dent James Q
Home Financials for this Owner
Home Financials are based on the most recent Mortgage that was taken out on this home.
Original Mortgage
$314,622
Interest Rate
4.16%
Mortgage Type
VA
Purchase Details
Closed on
Nov 14, 2011
Sold by
Saint Aubyn Homes Llc
Bought by
Omobehin Folorunsho Nicholas
Home Financials for this Owner
Home Financials are based on the most recent Mortgage that was taken out on this home.
Original Mortgage
$273,501
Interest Rate
3.99%
Mortgage Type
VA
Create a Home Valuation Report for This Property
The Home Valuation Report is an in-depth analysis detailing your home's value as well as a comparison with similar homes in the area
Home Values in the Area
Average Home Value in this Area
Purchase History
| Date | Buyer | Sale Price | Title Company |
|---|---|---|---|
| Perkins Caleb Ross | $354,000 | Land Title Guarantee Co | |
| Dent James Q | $308,000 | North American Title | |
| Omobehin Folorunsho Nicholas | $267,745 | Heritage Title |
Source: Public Records
Mortgage History
| Date | Status | Borrower | Loan Amount |
|---|---|---|---|
| Open | Perkins Caleb Ross | $300,900 | |
| Previous Owner | Dent James Q | $314,622 | |
| Previous Owner | Omobehin Folorunsho Nicholas | $273,501 |
Source: Public Records
Tax History Compared to Growth
Tax History
| Year | Tax Paid | Tax Assessment Tax Assessment Total Assessment is a certain percentage of the fair market value that is determined by local assessors to be the total taxable value of land and additions on the property. | Land | Improvement |
|---|---|---|---|---|
| 2025 | $4,681 | $33,670 | -- | -- |
| 2024 | $4,640 | $34,800 | $6,040 | $28,760 |
| 2022 | $3,422 | $24,720 | $4,810 | $19,910 |
| 2021 | $3,563 | $25,430 | $4,950 | $20,480 |
| 2020 | $3,502 | $24,730 | $4,330 | $20,400 |
| 2019 | $3,490 | $24,730 | $4,330 | $20,400 |
| 2018 | $3,055 | $21,310 | $4,360 | $16,950 |
| 2017 | $3,118 | $21,310 | $4,360 | $16,950 |
| 2016 | $2,851 | $22,030 | $4,380 | $17,650 |
| 2015 | $3,004 | $22,030 | $4,380 | $17,650 |
| 2014 | $2,990 | $22,030 | $4,290 | $17,740 |
Source: Public Records
Map
Nearby Homes
- 6266 Bearcat Loop
- 6254 Bearcat Loop
- 6272 Bearcat Loop
- 6248 Bearcat Loop
- 6154 Pilgrimage Rd
- 6138 Pilgrimage Rd
- 6162 Pilgrimage Rd
- 6242 Bearcat Loop
- 6278 Bearcat Loop
- 6265 Bearcat Loop
- 6253 Bearcat Loop
- 6247 Bearcat Loop
- 6284 Bearcat Loop
- 6236 Bearcat Loop
- 6307 Bearcat Loop
- 6178 Pilgrimage Rd
- 6235 Bearcat Loop
- 6390 Wallowing Way
- 6230 Bearcat Loop
- 6391 Wallowing Way