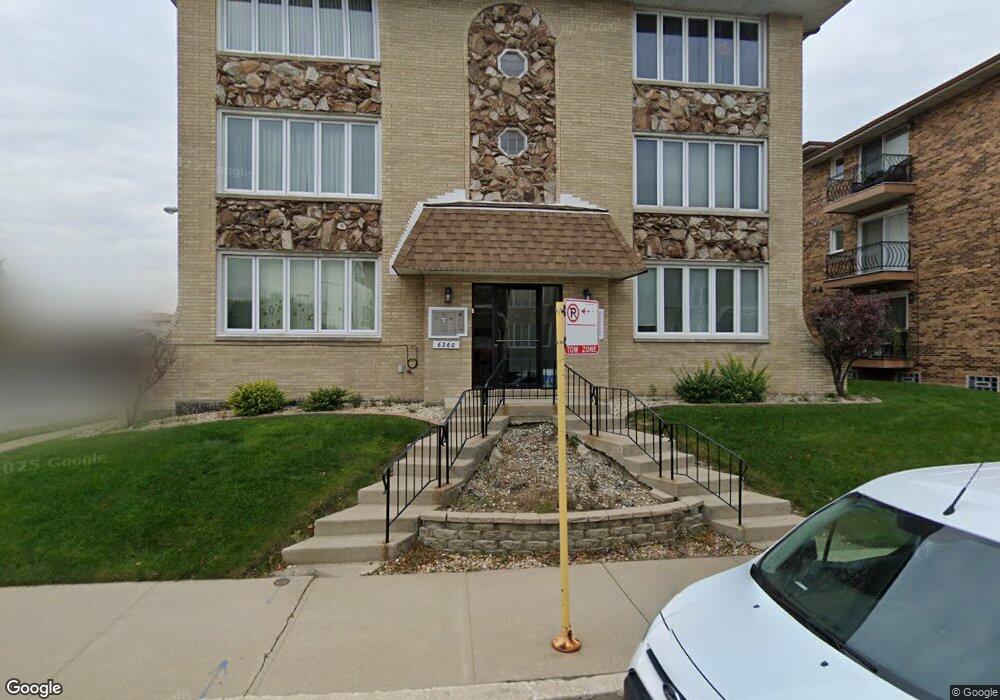
6260 S Newland Ave Unit 11S Chicago, IL 60638
Clearing NeighborhoodEstimated Value: $234,000 - $247,000
2
Beds
2
Baths
--
Sq Ft
1.39
Acres
About This Home
This home is located at 6260 S Newland Ave Unit 11S, Chicago, IL 60638 and is currently estimated at $242,634. 6260 S Newland Ave Unit 11S is a home located in Cook County with nearby schools including Dore Elementary School, Kennedy High School, and Peckwas Preparatory Academy.
Ownership History
Date
Name
Owned For
Owner Type
Purchase Details
Closed on
Feb 26, 2025
Sold by
Stiffend Jeremiah
Bought by
Dela Luz Heather and De La Luz
Current Estimated Value
Home Financials for this Owner
Home Financials are based on the most recent Mortgage that was taken out on this home.
Original Mortgage
$231,830
Outstanding Balance
$230,702
Interest Rate
7.13%
Mortgage Type
New Conventional
Estimated Equity
$11,932
Purchase Details
Closed on
Feb 24, 2021
Sold by
Burns Kristie and Burns Dennis Mccabe
Bought by
Stiffend Jeremiah
Home Financials for this Owner
Home Financials are based on the most recent Mortgage that was taken out on this home.
Original Mortgage
$147,184
Interest Rate
2.73%
Mortgage Type
FHA
Purchase Details
Closed on
Nov 22, 2006
Sold by
Fuerst Rose
Bought by
Burns Kristie
Purchase Details
Closed on
Jan 29, 1996
Sold by
Dolezal Therese M
Bought by
Fuerst Rose
Purchase Details
Closed on
Jan 1, 1996
Sold by
Dyjak Joseph J
Bought by
Fuerst Rose
Create a Home Valuation Report for This Property
The Home Valuation Report is an in-depth analysis detailing your home's value as well as a comparison with similar homes in the area
Home Values in the Area
Average Home Value in this Area
Purchase History
| Date | Buyer | Sale Price | Title Company |
|---|---|---|---|
| Dela Luz Heather | $239,000 | Fidelity National Title | |
| Stiffend Jeremiah | $150,000 | Chicago Title | |
| Burns Kristie | $173,000 | Ticor Title Insurance | |
| Fuerst Rose | -- | -- | |
| Fuerst Rose | -- | -- | |
| Fuerst Rose | $94,500 | -- |
Source: Public Records
Mortgage History
| Date | Status | Borrower | Loan Amount |
|---|---|---|---|
| Open | Dela Luz Heather | $231,830 | |
| Previous Owner | Stiffend Jeremiah | $147,184 |
Source: Public Records
Tax History Compared to Growth
Tax History
| Year | Tax Paid | Tax Assessment Tax Assessment Total Assessment is a certain percentage of the fair market value that is determined by local assessors to be the total taxable value of land and additions on the property. | Land | Improvement |
|---|---|---|---|---|
| 2024 | $2,479 | $17,818 | $1,443 | $16,375 |
| 2023 | $2,395 | $15,000 | $1,288 | $13,712 |
| 2022 | $2,395 | $15,000 | $1,288 | $13,712 |
| 2021 | $2,346 | $14,999 | $1,288 | $13,711 |
| 2020 | $1,511 | $9,841 | $1,030 | $8,811 |
| 2019 | $1,521 | $10,951 | $1,030 | $9,921 |
| 2018 | $1,494 | $10,951 | $1,030 | $9,921 |
| 2017 | $1,216 | $8,988 | $927 | $8,061 |
| 2016 | $1,309 | $8,988 | $927 | $8,061 |
| 2015 | $1,175 | $8,988 | $927 | $8,061 |
| 2014 | $1,130 | $8,611 | $875 | $7,736 |
| 2013 | $1,097 | $8,611 | $875 | $7,736 |
Source: Public Records
Map
Nearby Homes
- 6857 W 63rd Place
- 6850 W 64th St
- 6927 W 64th Place Unit 2E
- 6419 S Oak Park Ave Unit E-25
- 7216 W 63rd Place
- 7224 W 63rd Place
- 7241 W 62nd St
- 6659 W 64th Place Unit 305
- 6031 S Normandy Ave
- 6206 S Nashville Ave
- 6637 W 64th Place
- 6104 S Nashville Ave
- 7330 W 61st Place
- 5950 S Natoma Ave
- 6020 S Nashville Ave
- 7409 W 63rd Place
- 7400 W 61st St
- 7211 W 58th Place
- 5820 S Rutherford Ave
- 5745 S Sayre Ave
- 6260 S Newland Ave Unit 12S
- 6260 S Newland Ave Unit 12N
- 6260 S Newland Ave Unit 11N
- 6260 S Newland Ave Unit 13N
- 6260 S Newland Ave Unit 13S
- 6260 S Newland Ave Unit 1N
- 6260 S Newland Ave Unit 3N
- 6252 S Newland Ave Unit 23N
- 6252 S Newland Ave Unit 21S
- 6252 S Newland Ave Unit 21N
- 6252 S Newland Ave Unit 22S
- 6252 S Newland Ave Unit 22N
- 6252 S Newland Ave Unit 23S
- 6252 S Newland Ave Unit 3N
- 6252 S Newland Ave Unit 2N
- 6252 S Newland Ave Unit 2S
- 6940 W 63rd Place
- 6244 S Newland Ave Unit 1N
- 6244 S Newland Ave Unit 73S
- 6244 S Newland Ave Unit 72N