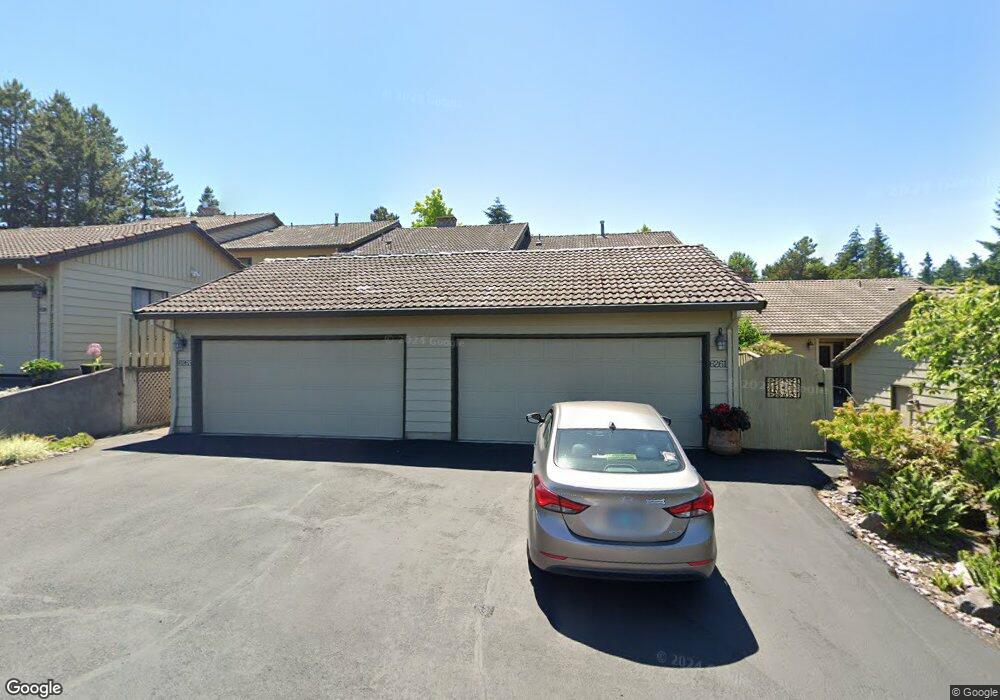
6261 Belmont Way West Linn, OR 97068
Hidden Springs NeighborhoodEstimated Value: $336,000 - $514,000
3
Beds
3
Baths
1,824
Sq Ft
$251/Sq Ft
Est. Value
About This Home
This home is located at 6261 Belmont Way, West Linn, OR 97068 and is currently estimated at $457,526, approximately $250 per square foot. 6261 Belmont Way is a home located in Clackamas County with nearby schools including Trillium Creek Primary School, Rosemont Ridge Middle School, and West Linn High School.
Ownership History
Date
Name
Owned For
Owner Type
Purchase Details
Closed on
Oct 17, 2016
Sold by
Brennan Meghan Elizabeth
Bought by
Erickson John A and Erickson Karen G
Current Estimated Value
Home Financials for this Owner
Home Financials are based on the most recent Mortgage that was taken out on this home.
Original Mortgage
$106,000
Outstanding Balance
$84,696
Interest Rate
3.44%
Mortgage Type
Commercial
Estimated Equity
$372,830
Purchase Details
Closed on
Sep 24, 2015
Sold by
Sickler Cynthia Q
Bought by
Brennan Meghan Elizabeth
Home Financials for this Owner
Home Financials are based on the most recent Mortgage that was taken out on this home.
Original Mortgage
$239,590
Interest Rate
3.9%
Mortgage Type
Commercial
Purchase Details
Closed on
Jul 10, 1997
Sold by
Wasbrough Sula A
Bought by
Sickler Cynthia Q
Home Financials for this Owner
Home Financials are based on the most recent Mortgage that was taken out on this home.
Original Mortgage
$150,300
Interest Rate
7.93%
Mortgage Type
Commercial
Create a Home Valuation Report for This Property
The Home Valuation Report is an in-depth analysis detailing your home's value as well as a comparison with similar homes in the area
Home Values in the Area
Average Home Value in this Area
Purchase History
| Date | Buyer | Sale Price | Title Company |
|---|---|---|---|
| Erickson John A | $299,900 | Wfg Title | |
| Brennan Meghan Elizabeth | $247,000 | Wfg Title | |
| Sickler Cynthia Q | $167,000 | Stewart Title |
Source: Public Records
Mortgage History
| Date | Status | Borrower | Loan Amount |
|---|---|---|---|
| Open | Erickson John A | $106,000 | |
| Previous Owner | Brennan Meghan Elizabeth | $239,590 | |
| Previous Owner | Sickler Cynthia Q | $150,300 |
Source: Public Records
Tax History Compared to Growth
Tax History
| Year | Tax Paid | Tax Assessment Tax Assessment Total Assessment is a certain percentage of the fair market value that is determined by local assessors to be the total taxable value of land and additions on the property. | Land | Improvement |
|---|---|---|---|---|
| 2025 | $4,958 | $257,247 | -- | -- |
| 2024 | $4,772 | $249,755 | -- | -- |
| 2023 | $4,772 | $242,481 | $0 | $0 |
| 2022 | $4,504 | $235,419 | $0 | $0 |
| 2021 | $4,268 | $228,563 | $0 | $0 |
| 2020 | $4,270 | $221,906 | $0 | $0 |
| 2019 | $4,105 | $215,443 | $0 | $0 |
| 2018 | $3,922 | $209,168 | $0 | $0 |
| 2017 | $3,663 | $203,076 | $0 | $0 |
| 2016 | $3,476 | $197,161 | $0 | $0 |
| 2015 | $3,283 | $191,418 | $0 | $0 |
| 2014 | $3,089 | $185,843 | $0 | $0 |
Source: Public Records
Map
Nearby Homes
- 6275 Clubhouse Cir
- 6233 Meridian Cir
- 2024 Conestoga Ln
- 6135 Cheyenne Terrace
- 2038 Titan Terrace
- 2583 Pimlico Dr
- 19874 Bennington Ct
- 19788 Wildwood Dr
- 20111 Hoodview Ave
- 19770 Wildwood Dr
- 3710 Mohawk Way
- 2005 Carriage Way
- 20120 Larkspur Ln Unit 85
- 21065 Apollo Ct
- 20030 Marigold Ct Unit 15
- 4057 Heron Dr
- 20322 Noble Ln
- 20349 Noble Ln
- 4050 Serango Ct
- 19885 Willamette Dr
- 6263 Belmont Way
- 6265 Belmont Way
- 6267 Belmont Way
- 6238 Belmont Way
- 6269 Belmont Way
- 6232 Belmont Way
- 6218 Belmont Way
- 6264 Belmont Way
- 6266 Belmont Way
- 6268 Belmont Way Unit 20
- 6268 Belmont Way
- 6235 Clubhouse Cir
- 6283 Tack Ct
- 6235 Clubhouse Relist
- 6235 Club House Cir
- 6212 Belmont Way
- 6286 Belmont Way
- 6286 Belmont Way Unit 38
- 6208 Belmont Way
- 6271 Tack Ct