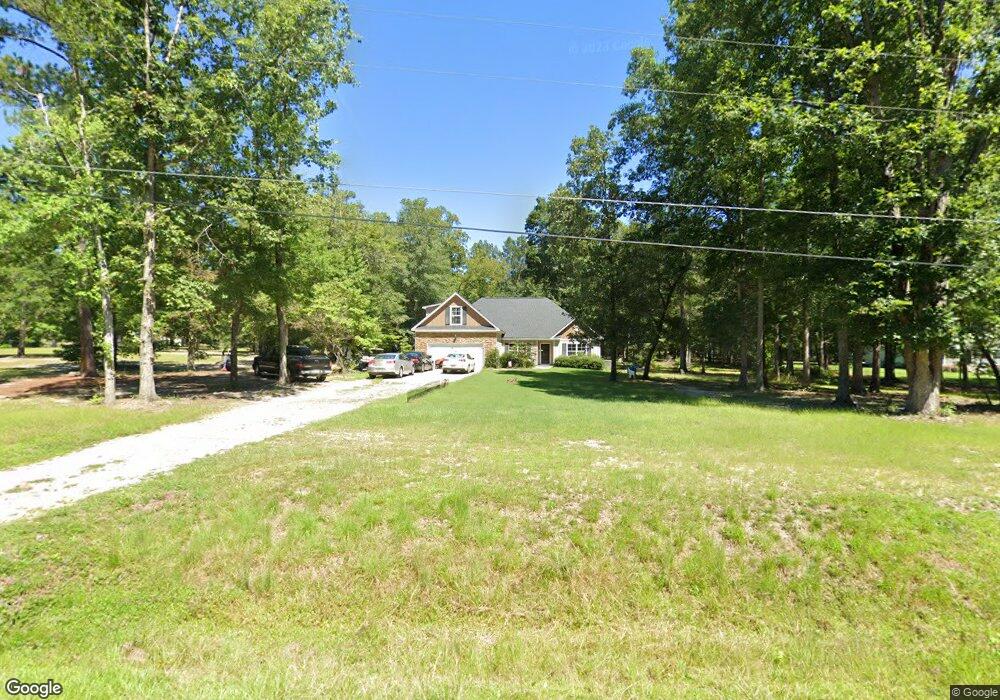
6265 Browns Rd Harlem, GA 30814
Estimated Value: $347,977 - $401,000
4
Beds
3
Baths
2,016
Sq Ft
$187/Sq Ft
Est. Value
About This Home
This home is located at 6265 Browns Rd, Harlem, GA 30814 and is currently estimated at $375,994, approximately $186 per square foot. 6265 Browns Rd is a home with nearby schools including Euchee Creek Elementary School, Harlem Middle School, and Harlem High School.
Ownership History
Date
Name
Owned For
Owner Type
Purchase Details
Closed on
Oct 22, 2010
Sold by
Nason Homes Llc
Bought by
Mckinnon Walter C
Current Estimated Value
Home Financials for this Owner
Home Financials are based on the most recent Mortgage that was taken out on this home.
Original Mortgage
$36,000
Outstanding Balance
$24,223
Interest Rate
4.74%
Mortgage Type
New Conventional
Estimated Equity
$351,771
Purchase Details
Closed on
Jul 12, 2010
Sold by
Simmons Jr Hannable A
Bought by
Mckinnon Walter C
Home Financials for this Owner
Home Financials are based on the most recent Mortgage that was taken out on this home.
Original Mortgage
$36,000
Interest Rate
4.74%
Mortgage Type
New Conventional
Purchase Details
Closed on
Dec 20, 2007
Sold by
Jones H Jerome
Bought by
Simmons Jr Hannable A
Home Financials for this Owner
Home Financials are based on the most recent Mortgage that was taken out on this home.
Original Mortgage
$30,523
Interest Rate
6.15%
Mortgage Type
New Conventional
Create a Home Valuation Report for This Property
The Home Valuation Report is an in-depth analysis detailing your home's value as well as a comparison with similar homes in the area
Home Values in the Area
Average Home Value in this Area
Purchase History
| Date | Buyer | Sale Price | Title Company |
|---|---|---|---|
| Mckinnon Walter C | $190,000 | -- | |
| Mckinnon Walter C | $190,000 | -- | |
| Mckinnon Walter C | $35,000 | -- | |
| Simmons Jr Hannable A | $33,000 | -- |
Source: Public Records
Mortgage History
| Date | Status | Borrower | Loan Amount |
|---|---|---|---|
| Open | Mckinnon Walter C | $36,000 | |
| Open | Mckinnon Walter C | $152,000 | |
| Previous Owner | Mckinnon Walter C | $36,000 | |
| Previous Owner | Simmons Jr Hannable A | $30,523 |
Source: Public Records
Tax History Compared to Growth
Tax History
| Year | Tax Paid | Tax Assessment Tax Assessment Total Assessment is a certain percentage of the fair market value that is determined by local assessors to be the total taxable value of land and additions on the property. | Land | Improvement |
|---|---|---|---|---|
| 2024 | $2,835 | $115,502 | $20,172 | $95,330 |
| 2023 | $2,835 | $112,209 | $20,172 | $92,037 |
| 2022 | $2,571 | $100,951 | $20,172 | $80,779 |
| 2021 | $2,430 | $91,371 | $20,172 | $71,199 |
| 2020 | $2,528 | $93,040 | $19,786 | $73,254 |
| 2019 | $2,502 | $92,091 | $18,743 | $73,348 |
| 2018 | $2,562 | $93,951 | $18,743 | $75,208 |
| 2017 | $2,255 | $82,643 | $18,743 | $63,900 |
| 2016 | $2,201 | $83,691 | $16,771 | $66,920 |
| 2015 | $2,210 | $83,865 | $16,771 | $67,094 |
| 2014 | $2,130 | $79,936 | $15,380 | $64,556 |
Source: Public Records
Map
Nearby Homes
- 2110 Shell Point Ct
- 385 Shagbark Way
- 390 Shagbark Way
- 365 Shagbark Way
- 425-430 Shagbark Way
- A 000 Wrightsboro Rd
- A 000 Wrightsboro Dr
- 0 Wrightsboro Rd
- 1523 Old Appling Harlem Hwy
- 1571 Powell Church Rd
- 1560 Swint Rd
- 1584 Swint Rd
- 1566 Swint Rd
- 1572 Swint Rd
- 1578 Swint Rd
- 1536 Swint Rd
- 1542 Swint Rd
- 1548 Swint Rd
- 1554 Swint Rd
- 1524 Swint Rd
- 6261 Browns Rd
- 6275 Browns Rd
- 6262 Browns Rd
- 6258 Browns Rd
- 6281 Browns Rd
- 6276 Browns Rd
- 6251 Browns Rd
- 6272 Browns Rd Unit L
- 6254 Browns Rd
- 1391 Pine Needle Dr
- 6282 Browns Rd
- 6285 Browns Rd
- 1392 Pine Needle Dr
- 6248 Browns Rd
- 6247 Browns Rd
- 4600 Browns Rd
- 6290 Browns Rd
- 6291 Browns Rd
- 6447 Carriage Ln
- 6241 Browns Rd