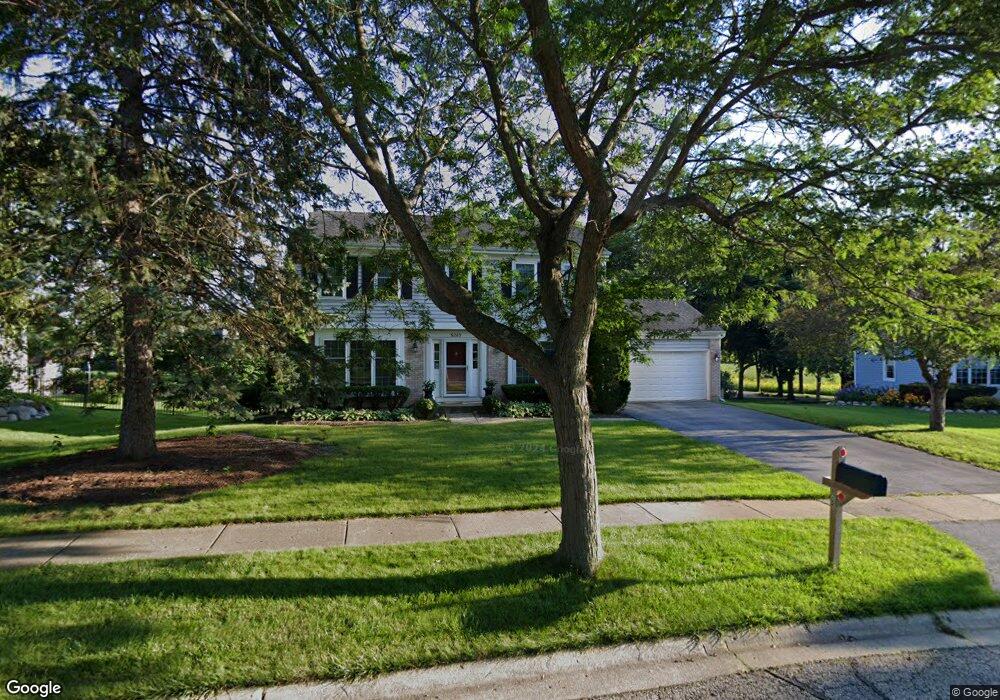
6265 Sleepy Hollow Ln Gurnee, IL 60031
Estimated Value: $400,000 - $423,000
4
Beds
3
Baths
1,908
Sq Ft
$214/Sq Ft
Est. Value
About This Home
This home is located at 6265 Sleepy Hollow Ln, Gurnee, IL 60031 and is currently estimated at $407,709, approximately $213 per square foot. 6265 Sleepy Hollow Ln is a home located in Lake County with nearby schools including Woodland Primary School, Woodland Intermediate School, and Woodland Elementary School.
Ownership History
Date
Name
Owned For
Owner Type
Purchase Details
Closed on
May 22, 2023
Sold by
Brodsky David P and Sergel Madelyn R
Bought by
David Brodsky And Madelyn Sergei Family Trust and Brodsky
Current Estimated Value
Purchase Details
Closed on
Feb 20, 1998
Sold by
Wittkamp Donald E and Jones Christina M
Bought by
Brodsky David P and Sergel Madelyn R
Home Financials for this Owner
Home Financials are based on the most recent Mortgage that was taken out on this home.
Original Mortgage
$175,000
Interest Rate
6.95%
Purchase Details
Closed on
Jun 20, 1997
Sold by
Jones Christina
Bought by
Wittkamp Donald E and Jones Christina M
Purchase Details
Closed on
Jul 15, 1996
Sold by
Mcaulliffe Patrick and Mcauliffe Pat
Bought by
Jones Christina M
Home Financials for this Owner
Home Financials are based on the most recent Mortgage that was taken out on this home.
Original Mortgage
$140,000
Interest Rate
8.37%
Create a Home Valuation Report for This Property
The Home Valuation Report is an in-depth analysis detailing your home's value as well as a comparison with similar homes in the area
Home Values in the Area
Average Home Value in this Area
Purchase History
| Date | Buyer | Sale Price | Title Company |
|---|---|---|---|
| David Brodsky And Madelyn Sergei Family Trust | -- | None Listed On Document | |
| Brodsky David P | $199,500 | -- | |
| Wittkamp Donald E | -- | -- | |
| Jones Christina M | $182,000 | Attorneys Natl Title Network |
Source: Public Records
Mortgage History
| Date | Status | Borrower | Loan Amount |
|---|---|---|---|
| Previous Owner | Brodsky David P | $175,000 | |
| Previous Owner | Jones Christina M | $140,000 |
Source: Public Records
Tax History Compared to Growth
Tax History
| Year | Tax Paid | Tax Assessment Tax Assessment Total Assessment is a certain percentage of the fair market value that is determined by local assessors to be the total taxable value of land and additions on the property. | Land | Improvement |
|---|---|---|---|---|
| 2024 | $9,476 | $112,476 | $18,692 | $93,784 |
| 2023 | $9,277 | $104,425 | $17,354 | $87,071 |
| 2022 | $9,277 | $101,176 | $17,366 | $83,810 |
| 2021 | $8,382 | $97,116 | $16,669 | $80,447 |
| 2020 | $8,110 | $94,729 | $16,259 | $78,470 |
| 2019 | $7,878 | $91,979 | $15,787 | $76,192 |
| 2018 | $7,297 | $86,681 | $17,823 | $68,858 |
| 2017 | $7,218 | $84,197 | $17,312 | $66,885 |
| 2016 | $7,156 | $80,448 | $16,541 | $63,907 |
| 2015 | $6,964 | $76,298 | $15,688 | $60,610 |
| 2014 | $6,999 | $77,145 | $15,491 | $61,654 |
| 2012 | $6,636 | $77,736 | $15,610 | $62,126 |
Source: Public Records
Map
Nearby Homes
- 6191 Oakmont Ln
- 6161 Oakmont Ln
- 6402 Barn Swallow Ct
- 295 N Hunt Club Rd
- 6296 Doral Dr
- 6359 Doral Dr
- 17119 W Prairieview Ln
- 17404 W Walnut Ln Unit 2C
- 34040 N White Oak Ln Unit 46C
- 650 Whitney Ct Unit 203
- 17429 W Chestnut Ln Unit 13A
- 690 Chandler Rd Unit 102
- 690 Chandler Rd Unit 207
- 690 Chandler Rd Unit 305
- 6121 Brookstone Place
- 638 Dordan Ct
- 6091 Washington St
- 17150 Washington St
- 17514 W Bridle Ct
- 651 White Ct
- 6253 Sleepy Hollow Ln
- 6271 Sleepy Hollow Ln
- 6264 Sleepy Hollow Ln Unit 3
- 6279 Sleepy Hollow Ln
- 242 Big Terra Ln
- 6241 Sleepy Hollow Ln Unit 3
- 245 Big Terra Ln
- 6280 Sleepy Hollow Ln
- 6248 Sleepy Hollow Ln
- 6229 Sleepy Hollow Ln
- 6232 Sleepy Hollow Ln
- 246 Big Terra Ln Unit 1
- 249 Big Terra Ln
- 137 Knobb Hill Ln
- 141 Knobb Hill Ln
- 133 Knobb Hill Ln
- 129 Knobb Hill Ln
- 6216 Sleepy Hollow Ln
- 6293 Sleepy Hollow Ln
- 6207 Sleepy Hollow Ln