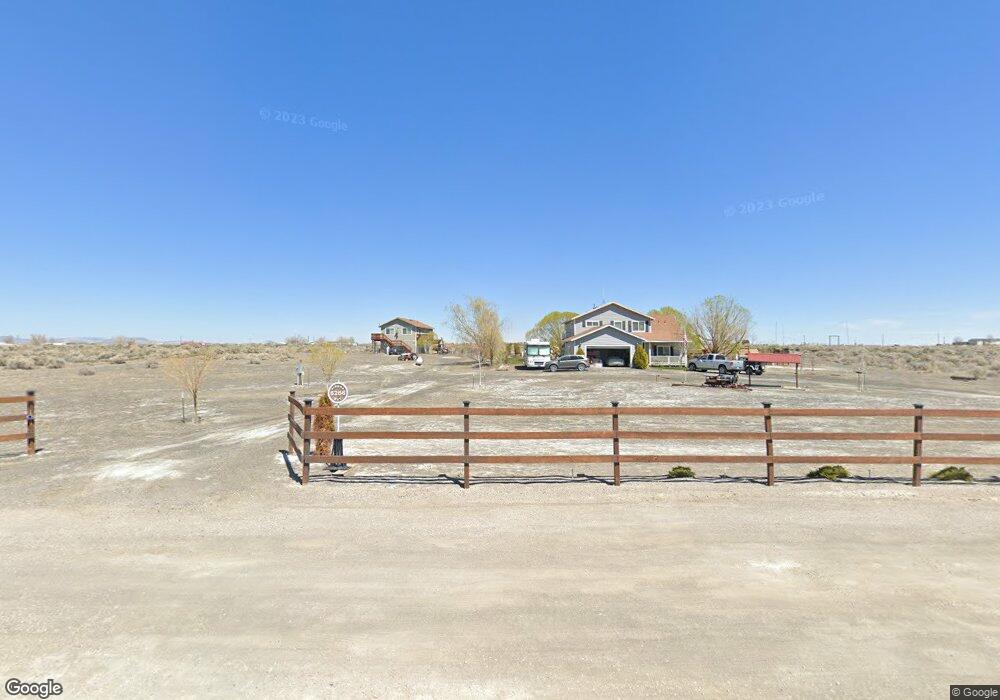
6266 Sierra Way Fallon, NV 89406
Estimated Value: $522,000 - $654,660
3
Beds
2
Baths
2,182
Sq Ft
$274/Sq Ft
Est. Value
About This Home
This home is located at 6266 Sierra Way, Fallon, NV 89406 and is currently estimated at $598,220, approximately $274 per square foot. 6266 Sierra Way is a home located in Churchill County with nearby schools including Lahontan Elementary School, E.C. Best Elementary School, and Numa Elementary School.
Ownership History
Date
Name
Owned For
Owner Type
Purchase Details
Closed on
Jun 8, 2010
Sold by
M & I Bank Fsb
Bought by
Shuey Charles D and Shuey Deborah L
Current Estimated Value
Purchase Details
Closed on
Nov 20, 2009
Sold by
Clack Daniel and Allen Jd
Bought by
M & I Bank Fsb
Purchase Details
Closed on
Mar 27, 2007
Sold by
Tate Robert R and Tate Nancy C
Bought by
Clack Daniel and Allen Jd
Home Financials for this Owner
Home Financials are based on the most recent Mortgage that was taken out on this home.
Original Mortgage
$280,000
Interest Rate
6.41%
Mortgage Type
Purchase Money Mortgage
Purchase Details
Closed on
Jan 20, 2006
Sold by
Tate Robert R and Tate Nancy C
Bought by
Tate Robert R and Tate Nancy C
Create a Home Valuation Report for This Property
The Home Valuation Report is an in-depth analysis detailing your home's value as well as a comparison with similar homes in the area
Home Values in the Area
Average Home Value in this Area
Purchase History
| Date | Buyer | Sale Price | Title Company |
|---|---|---|---|
| Shuey Charles D | $65,000 | Western Nevada Title Company | |
| M & I Bank Fsb | $41,707 | First American Title | |
| Clack Daniel | $68,000 | Stewart Title Company | |
| Tate Robert R | $35,000 | Stewart Title Company |
Source: Public Records
Mortgage History
| Date | Status | Borrower | Loan Amount |
|---|---|---|---|
| Previous Owner | Clack Daniel | $280,000 |
Source: Public Records
Tax History Compared to Growth
Tax History
| Year | Tax Paid | Tax Assessment Tax Assessment Total Assessment is a certain percentage of the fair market value that is determined by local assessors to be the total taxable value of land and additions on the property. | Land | Improvement |
|---|---|---|---|---|
| 2025 | $2,807 | $156,409 | $17,973 | $138,436 |
| 2024 | $2,807 | $150,789 | $13,559 | $137,230 |
| 2023 | $2,807 | $141,405 | $13,559 | $127,846 |
| 2022 | $2,638 | $116,622 | $6,125 | $110,497 |
| 2021 | $2,553 | $112,738 | $6,125 | $106,613 |
| 2020 | $2,470 | $114,995 | $6,125 | $108,870 |
| 2019 | $2,246 | $98,146 | $6,125 | $92,021 |
| 2018 | $2,181 | $95,450 | $6,125 | $89,325 |
| 2017 | $2,115 | $95,412 | $6,125 | $89,287 |
| 2016 | $1,836 | $66,590 | $6,125 | $60,465 |
| 2015 | $1,800 | $60,558 | $6,125 | $54,433 |
| 2014 | $1,644 | $56,035 | $6,125 | $49,910 |
Source: Public Records
Map
Nearby Homes
- 6270 Westwind Way
- 6366 Westwind Way
- 1480 Michelle Dr
- 5211 Vanessa Dr
- 5980 Kadee Ct
- 7278 Reno Hwy
- 5800 Reno Hwy
- 6811 Reno Hwy
- 7135 Reno Hwy
- 195 Classic Way
- #00821198 Soda Lake Rd
- #00821196 Soda Lake Rd
- #00821197 Soda Lake Rd
- 200 Mclean Rd
- 3400 Trento Ln
- 774 Copperwood Dr
- 1001 Sheckler Cutoff
- 1001 Sheckler Cut Off
- 3939 Hillsboro Blvd
- 8245 Kamibo Dr
- 6312 Sierra Way
- 6214 Sierra Way
- 6305 Sierra Way
- 6035 Lakeview Dr
- 6205 Lakeview Dr
- 6155 Lakeview Dr
- 6255 Lakeview Dr
- 1959 Sprig Ln
- 5932 Dillon Dr
- 1970 Sprig Ln
- 5950 Dillon Dr
- 1990 Sprig Ln
- 5936 Dillon Dr
- 6166 Lakeview Dr
- 6466 Sierra Way
- 6471 Lakeview Dr
- 6355 Lakeview Dr
- 6212 Lakeview Dr
- 5925 Dillon Rd
- 6262 Lakeview Dr