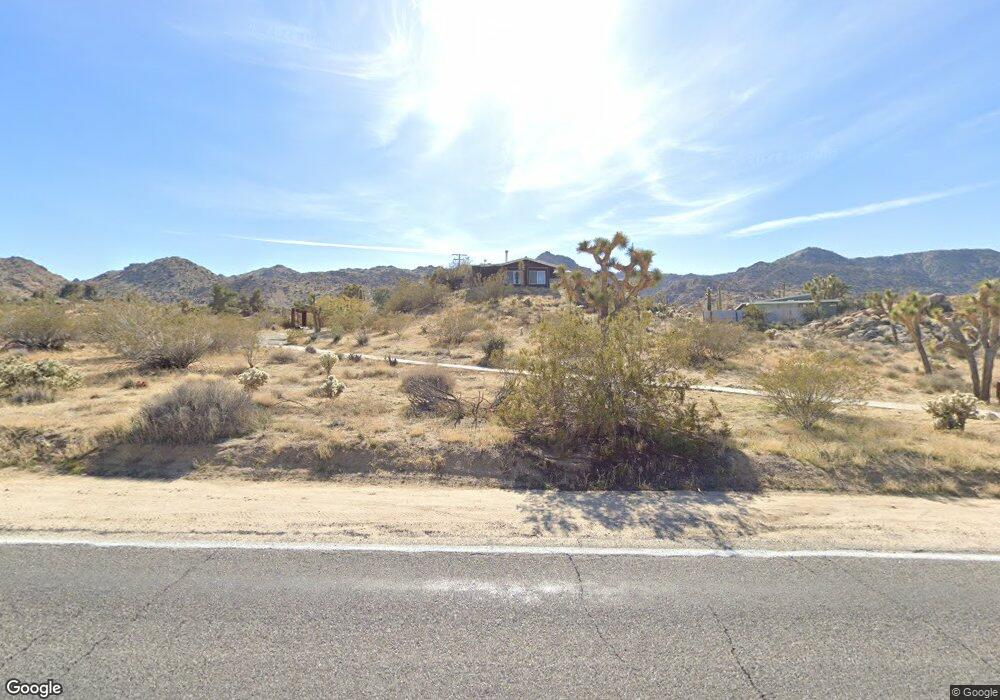
62677 Quail Springs Rd Joshua Tree, CA 92252
Estimated Value: $280,000 - $542,000
1
Bed
1
Bath
1,253
Sq Ft
$316/Sq Ft
Est. Value
About This Home
This home is located at 62677 Quail Springs Rd, Joshua Tree, CA 92252 and is currently estimated at $396,014, approximately $316 per square foot. 62677 Quail Springs Rd is a home with nearby schools including Friendly Hills Elementary School, La Contenta Middle School, and Yucca Valley High School.
Ownership History
Date
Name
Owned For
Owner Type
Purchase Details
Closed on
Sep 13, 2002
Sold by
Hill Ellen
Bought by
Hill Ellen
Current Estimated Value
Home Financials for this Owner
Home Financials are based on the most recent Mortgage that was taken out on this home.
Original Mortgage
$60,000
Outstanding Balance
$24,936
Interest Rate
6.17%
Estimated Equity
$371,078
Purchase Details
Closed on
Nov 2, 2001
Sold by
Beck Thomas Edwin
Bought by
Hill Ellen
Purchase Details
Closed on
Mar 5, 1997
Sold by
Norwest Mtg Inc
Bought by
Hud
Purchase Details
Closed on
Dec 27, 1996
Sold by
Bishop Douglas M and Bishop Susan V
Bought by
Norwest Mtg Inc
Purchase Details
Closed on
Jun 4, 1996
Sold by
Hud
Bought by
Beck Thomas Edwin and Hill Ellen
Home Financials for this Owner
Home Financials are based on the most recent Mortgage that was taken out on this home.
Original Mortgage
$38,300
Interest Rate
7.93%
Create a Home Valuation Report for This Property
The Home Valuation Report is an in-depth analysis detailing your home's value as well as a comparison with similar homes in the area
Home Values in the Area
Average Home Value in this Area
Purchase History
| Date | Buyer | Sale Price | Title Company |
|---|---|---|---|
| Hill Ellen | -- | Fidelity National Title | |
| Hill Ellen | -- | -- | |
| Hud | -- | First American Title Ins Co | |
| Norwest Mtg Inc | $95,908 | First American Title Ins Co | |
| Beck Thomas Edwin | $48,000 | Old Republic Title Company |
Source: Public Records
Mortgage History
| Date | Status | Borrower | Loan Amount |
|---|---|---|---|
| Open | Hill Ellen | $60,000 | |
| Previous Owner | Beck Thomas Edwin | $38,300 |
Source: Public Records
Tax History Compared to Growth
Tax History
| Year | Tax Paid | Tax Assessment Tax Assessment Total Assessment is a certain percentage of the fair market value that is determined by local assessors to be the total taxable value of land and additions on the property. | Land | Improvement |
|---|---|---|---|---|
| 2025 | $1,201 | $76,540 | $39,921 | $36,619 |
| 2024 | $1,201 | $75,039 | $39,138 | $35,901 |
| 2023 | $1,179 | $73,568 | $38,371 | $35,197 |
| 2022 | $1,156 | $72,126 | $37,619 | $34,507 |
| 2021 | $1,142 | $70,711 | $36,881 | $33,830 |
| 2020 | $1,131 | $69,986 | $36,503 | $33,483 |
| 2019 | $1,179 | $68,613 | $35,787 | $32,826 |
| 2018 | $1,011 | $67,267 | $35,085 | $32,182 |
| 2017 | $1,001 | $65,948 | $34,397 | $31,551 |
| 2016 | $985 | $64,655 | $33,723 | $30,932 |
| 2015 | $967 | $63,683 | $33,216 | $30,467 |
| 2014 | $959 | $62,435 | $32,565 | $29,870 |
Source: Public Records
Map
Nearby Homes
- 62398 Cope Ln
- 62570 Turtle Rd
- 9073 Tortuga Trail
- 8669 Via Rocosa Rd
- 8825 Lilley Rd
- 8520 Purple Sage Rd
- 63131 Rocking Chair Rd
- 8256 Quail Springs Rd
- 8775 Desert Shadow Rd
- 8776 Uphill Rd
- 8744 Star Ln
- 8333 Star Ln
- 62200 Skyline Dr
- 63576 Single Tree Rd
- 8173 Fleur Dr
- 7802 Quail Springs Rd
- 63670 Wagon Wheel Rd
- 4773 California Ave
- 7765 Elwood St
- 7800 Sunset Rd
- 0 Quail Springs Rd Unit DC21131116
- 0 Quail Springs Rd Unit DC21133888
- 0 Quail Springs Rd Unit DC14198625
- 0 Quail Springs Rd Unit EV15055605
- 0 Quail Springs Rd Unit JT17014889
- 0 Quail Springs Rd Unit 41414863
- 0 Quail Springs Rd Unit 41442331
- 0 Quail Springs Rd Unit OC23060279
- 0 Quail Springs Rd Unit CV21241547
- 0 Quail Springs Rd Unit SDC0000103
- 0 Quail Springs Rd Unit 21-705032
- 0 Quail Springs Rd Unit JT21041262
- 0 Quail Springs Rd Unit 219057820
- 0 Quail Springs Rd Unit EV20160886
- 0 Quail Springs Rd Unit 219037656
- 62573 Kent Rd
- 62759 Quail Springs Rd
- 9755 Kent Dr
- 0 Kent Rd Unit JT15239770
- 62787 Quail Springs Rd