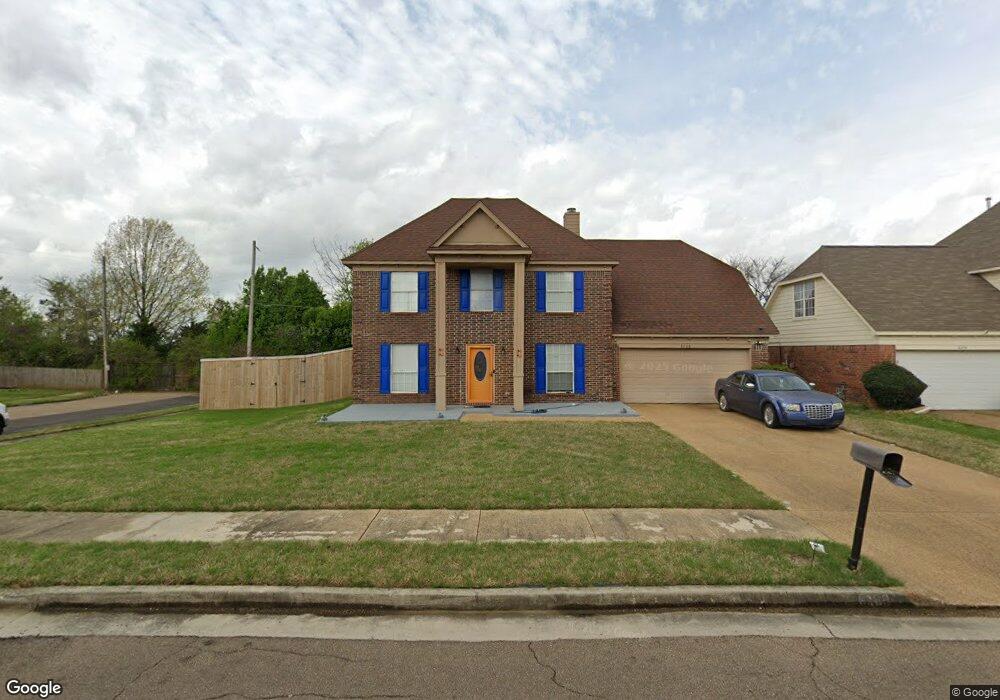
6268 Hayfield Ln W Memphis, TN 38141
Parkway Village NeighborhoodEstimated Value: $215,000 - $241,000
3
Beds
3
Baths
1,958
Sq Ft
$115/Sq Ft
Est. Value
About This Home
This home is located at 6268 Hayfield Ln W, Memphis, TN 38141 and is currently estimated at $225,636, approximately $115 per square foot. 6268 Hayfield Ln W is a home located in Shelby County with nearby schools including Ross Elementary School, Kirby High School, and Memphis Business Academy Hickory Hill Middle School.
Ownership History
Date
Name
Owned For
Owner Type
Purchase Details
Closed on
Feb 23, 2007
Sold by
Anderson Sharon K
Bought by
Mcatee Scedella
Current Estimated Value
Home Financials for this Owner
Home Financials are based on the most recent Mortgage that was taken out on this home.
Original Mortgage
$119,700
Outstanding Balance
$84,374
Interest Rate
9.62%
Mortgage Type
Purchase Money Mortgage
Estimated Equity
$141,262
Purchase Details
Closed on
Dec 28, 2000
Sold by
Reed & Associates Of Tn Llc
Bought by
Anderson Sharon K and Trust 6268 Hayfield Lane West
Purchase Details
Closed on
Jul 30, 1998
Sold by
Harris Shannon D
Bought by
Reed & Associates Of Tennessee Llc
Purchase Details
Closed on
Dec 17, 1997
Sold by
Bowden Bldg Corp
Bought by
Harris Shannon D
Home Financials for this Owner
Home Financials are based on the most recent Mortgage that was taken out on this home.
Original Mortgage
$117,397
Interest Rate
7.2%
Mortgage Type
FHA
Create a Home Valuation Report for This Property
The Home Valuation Report is an in-depth analysis detailing your home's value as well as a comparison with similar homes in the area
Home Values in the Area
Average Home Value in this Area
Purchase History
| Date | Buyer | Sale Price | Title Company |
|---|---|---|---|
| Mcatee Scedella | $119,700 | None Available | |
| Anderson Sharon K | -- | -- | |
| Reed & Associates Of Tennessee Llc | -- | -- | |
| Harris Shannon D | $117,000 | Southern Escrow Title Compan |
Source: Public Records
Mortgage History
| Date | Status | Borrower | Loan Amount |
|---|---|---|---|
| Open | Mcatee Scedella | $119,700 | |
| Previous Owner | Harris Shannon D | $117,397 |
Source: Public Records
Tax History Compared to Growth
Tax History
| Year | Tax Paid | Tax Assessment Tax Assessment Total Assessment is a certain percentage of the fair market value that is determined by local assessors to be the total taxable value of land and additions on the property. | Land | Improvement |
|---|---|---|---|---|
| 2025 | $1,352 | $51,725 | $8,750 | $42,975 |
| 2024 | $1,352 | $39,875 | $6,850 | $33,025 |
| 2023 | $1,352 | $39,875 | $6,850 | $33,025 |
| 2022 | $1,352 | $39,875 | $6,850 | $33,025 |
| 2021 | $1,376 | $39,875 | $6,850 | $33,025 |
| 2020 | $1,113 | $27,475 | $5,000 | $22,475 |
| 2019 | $1,113 | $27,475 | $5,000 | $22,475 |
| 2018 | $1,113 | $27,475 | $5,000 | $22,475 |
| 2017 | $1,129 | $27,475 | $5,000 | $22,475 |
| 2016 | $1,106 | $25,300 | $0 | $0 |
| 2014 | $1,106 | $25,300 | $0 | $0 |
Source: Public Records
Map
Nearby Homes
- 5389 Chinkapin Oak Cove
- 5340 Shady Ridge Cove
- 9082 Fox Cove
- 9091 Hunters Ridge Dr
- 9142 Mineral Wells Rd
- 6623 Cherry Bark Dr
- 6716 Shoreline Cir
- 8939 Youngblood Rd
- 6744 Shoreline Cir
- 8140 Hunters Hill Cove
- 6770 Shoreline Cir
- 4406 John Wood Ln
- 4432 John Wood Ln
- 8778 Mwc Rd
- 7885 Hunters Bend Cove
- 4821 Blue Wing St
- 4868 Water Fowl Ln
- 8700 Old Craft Rd
- 4741 Ross Creek Dr
- 6732 Henredon Dr
- 6274 Hayfield Ln W
- 6280 Hayfield Ln W
- 6301 Ragan Farm Dr
- 6320 Ragan Farm Dr
- 6275 Hayfield Ln W
- 6315 Ragan Farm Dr
- 6286 Hayfield Ln W
- 6281 Hayfield Ln W
- 6321 Ragan Farm Dr
- 6287 Hayfield Ln W
- 6292 Hayfield Ln W
- 5391 Farm Ridge Dr
- 6327 Ragan Farm Dr
- 5385 Farm Ridge Dr
- 5379 Farm Ridge Dr
- 6298 Hayfield Ln W
- 6293 Hayfield Ln W
- 6333 Ragan Farm Dr
- 5375 Farm Ridge Dr
- 6339 Ragan Farm Dr