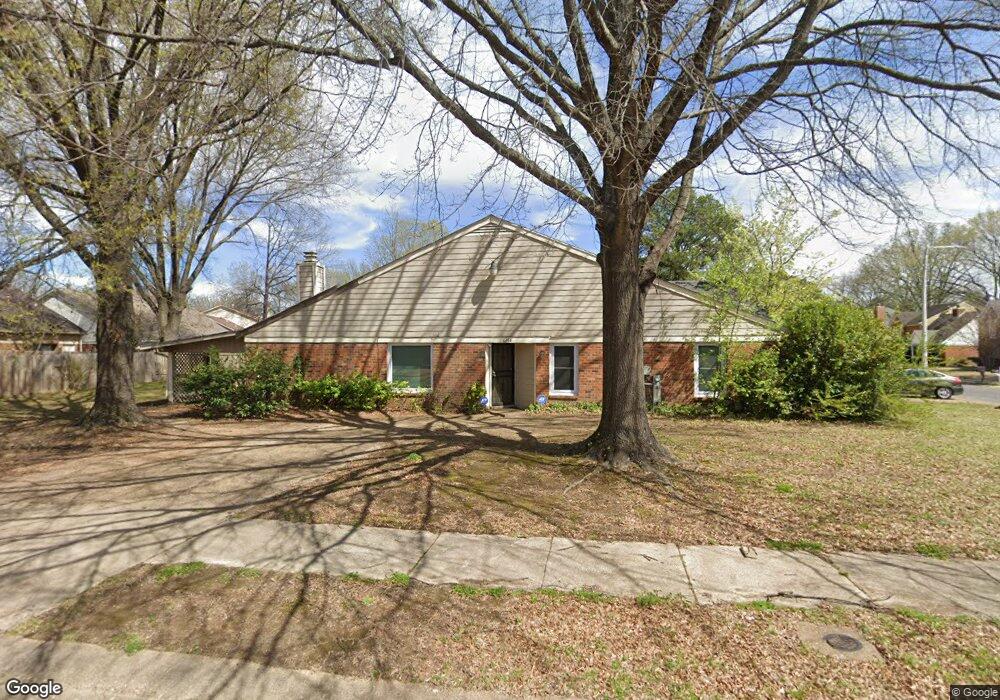
6268 Kirby Downs Dr Memphis, TN 38115
Hickory Hill NeighborhoodEstimated Value: $96,000 - $125,000
2
Beds
1
Bath
1,112
Sq Ft
$101/Sq Ft
Est. Value
About This Home
This home is located at 6268 Kirby Downs Dr, Memphis, TN 38115 and is currently estimated at $112,523, approximately $101 per square foot. 6268 Kirby Downs Dr is a home located in Shelby County with nearby schools including Belle Forest Community School, Hickory Ridge Middle School, and Kirby High School.
Ownership History
Date
Name
Owned For
Owner Type
Purchase Details
Closed on
Jan 26, 2019
Sold by
Greer Versie and Bell Willie J
Bought by
Greer Versie
Current Estimated Value
Home Financials for this Owner
Home Financials are based on the most recent Mortgage that was taken out on this home.
Original Mortgage
$54,032
Outstanding Balance
$34,811
Interest Rate
4.62%
Mortgage Type
FHA
Estimated Equity
$77,712
Purchase Details
Closed on
Apr 30, 2008
Sold by
Tuggle Jacquelyn Threadgill
Bought by
Greer Versie and Bell Willie J
Home Financials for this Owner
Home Financials are based on the most recent Mortgage that was taken out on this home.
Original Mortgage
$68,820
Interest Rate
5.82%
Mortgage Type
FHA
Purchase Details
Closed on
Aug 13, 2004
Sold by
Gray Dorothy P
Bought by
Hud
Purchase Details
Closed on
Aug 29, 2001
Sold by
Dixon Margaret L
Bought by
Gray Dorothy P
Home Financials for this Owner
Home Financials are based on the most recent Mortgage that was taken out on this home.
Original Mortgage
$68,955
Interest Rate
6.98%
Mortgage Type
FHA
Create a Home Valuation Report for This Property
The Home Valuation Report is an in-depth analysis detailing your home's value as well as a comparison with similar homes in the area
Home Values in the Area
Average Home Value in this Area
Purchase History
| Date | Buyer | Sale Price | Title Company |
|---|---|---|---|
| Greer Versie | -- | None Available | |
| Greer Versie | $69,900 | Executive Title & Closing In | |
| Hud | $77,533 | -- | |
| Gray Dorothy P | $69,500 | -- |
Source: Public Records
Mortgage History
| Date | Status | Borrower | Loan Amount |
|---|---|---|---|
| Open | Greer Versie | $54,032 | |
| Closed | Greer Versie | $68,820 | |
| Previous Owner | Gray Dorothy P | $68,955 |
Source: Public Records
Tax History Compared to Growth
Tax History
| Year | Tax Paid | Tax Assessment Tax Assessment Total Assessment is a certain percentage of the fair market value that is determined by local assessors to be the total taxable value of land and additions on the property. | Land | Improvement |
|---|---|---|---|---|
| 2025 | $613 | $26,325 | $4,400 | $21,925 |
| 2024 | $613 | $18,075 | $3,000 | $15,075 |
| 2023 | $1,101 | $18,075 | $3,000 | $15,075 |
| 2022 | $1,101 | $18,075 | $3,000 | $15,075 |
| 2021 | $1,114 | $18,075 | $3,000 | $15,075 |
| 2020 | $879 | $12,125 | $3,000 | $9,125 |
| 2019 | $879 | $12,125 | $3,000 | $9,125 |
| 2018 | $879 | $12,125 | $3,000 | $9,125 |
| 2017 | $498 | $12,125 | $3,000 | $9,125 |
| 2016 | $510 | $11,675 | $0 | $0 |
| 2014 | $510 | $11,675 | $0 | $0 |
Source: Public Records
Map
Nearby Homes
- 6289 Kirby Downs Dr
- 2974 New London
- 5995 Lofty Oak Rd
- 3179 Flowering Cherry Ln Unit 50
- 3172 Tulip Poplar Dr Unit 30
- 6435 Kirby Trees Dr Unit 50
- 3545 Ridgeway Rd
- 3336 Kirby Trees Place Unit 16
- 3338 Kirby Trees Place Unit 17
- 3340 Kirby Trees Place Unit 18
- 6443 Kirby Trees Dr Unit 38
- 3451 Ridgeway Rd
- 3344 Kirby Trees Place Unit 8
- 2961 Jib Cove Unit 30
- 3054 Inverness Parkway Dr
- 6350 Quince Rd
- 6677 Millers Pond Cir
- 2619 Crimmins Cove
- 2951 Millers Pond Dr
- 3009 Inverness Parkway Dr
- 6270 Kirby Downs Dr
- 6272 Kirby Downs Dr
- 6274 Kirby Downs Dr
- 6256 Kirby Downs Dr
- 6278 Kirby Downs Dr
- 3012 New London
- 3010 New London
- 3008 New London
- 6280 Kirby Downs Dr
- 3006 New London
- 6252 Kirby Downs Dr
- 6284 Kirby Downs Dr
- 3015 Charlestowne Place
- 6265 Kirby Downs Dr
- 6269 Kirby Downs Dr
- 6248 Kirby Downs Dr
- 6263 Kirby Downs Dr
- 6271 Kirby Downs Dr
- 6273 Kirby Downs Dr
- 6259 Kirby Downs Dr