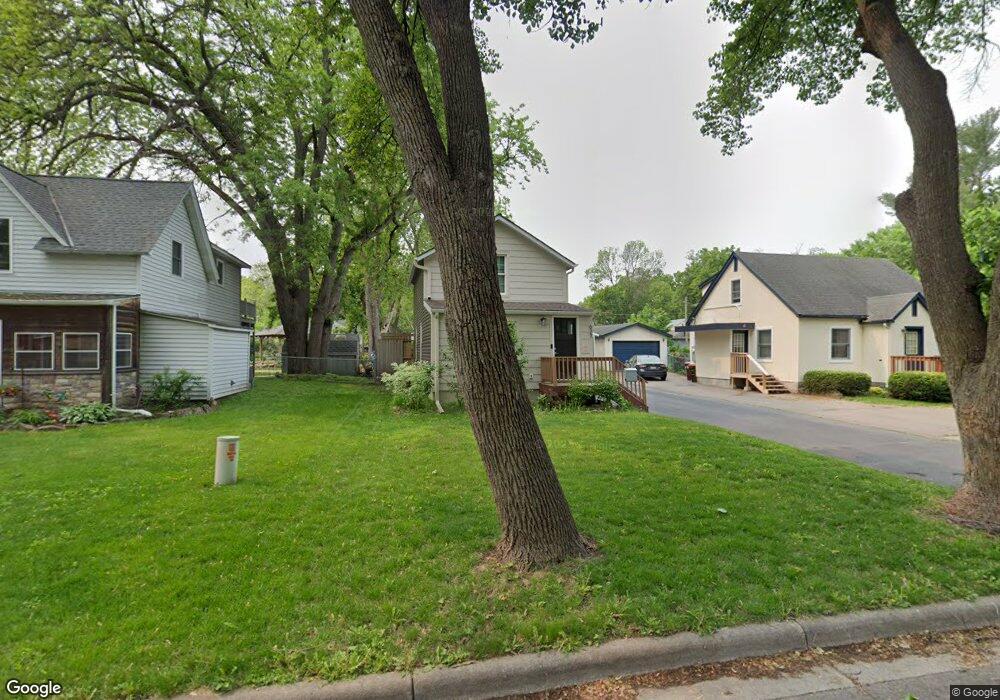
627 5th St W Hastings, MN 55033
Hastings-Marshan Township NeighborhoodEstimated Value: $240,000 - $266,000
2
Beds
1
Bath
1,010
Sq Ft
$246/Sq Ft
Est. Value
About This Home
This home is located at 627 5th St W, Hastings, MN 55033 and is currently estimated at $248,945, approximately $246 per square foot. 627 5th St W is a home located in Dakota County with nearby schools including Hastings Middle School, Christa Mcauliffe Elementary School, and Hastings High School.
Ownership History
Date
Name
Owned For
Owner Type
Purchase Details
Closed on
Jun 12, 2015
Sold by
Kloster Nathan T and Kloster Amanda L
Bought by
Johnson Brock R and Johnson Joy K
Current Estimated Value
Home Financials for this Owner
Home Financials are based on the most recent Mortgage that was taken out on this home.
Original Mortgage
$125,559
Outstanding Balance
$97,249
Interest Rate
3.75%
Mortgage Type
FHA
Estimated Equity
$151,696
Purchase Details
Closed on
Apr 11, 2008
Sold by
Dekart Rebecca S
Bought by
Not Provided
Create a Home Valuation Report for This Property
The Home Valuation Report is an in-depth analysis detailing your home's value as well as a comparison with similar homes in the area
Home Values in the Area
Average Home Value in this Area
Purchase History
| Date | Buyer | Sale Price | Title Company |
|---|---|---|---|
| Johnson Brock R | $129,900 | Edina Realty Title Inc | |
| Not Provided | $114,300 | -- |
Source: Public Records
Mortgage History
| Date | Status | Borrower | Loan Amount |
|---|---|---|---|
| Open | Johnson Brock R | $125,559 |
Source: Public Records
Tax History Compared to Growth
Tax History
| Year | Tax Paid | Tax Assessment Tax Assessment Total Assessment is a certain percentage of the fair market value that is determined by local assessors to be the total taxable value of land and additions on the property. | Land | Improvement |
|---|---|---|---|---|
| 2024 | $2,240 | $210,200 | $56,700 | $153,500 |
| 2023 | $2,240 | $208,900 | $56,700 | $152,200 |
| 2022 | $1,770 | $201,300 | $56,600 | $144,700 |
| 2021 | $1,656 | $162,300 | $49,300 | $113,000 |
| 2020 | $1,758 | $152,600 | $46,900 | $105,700 |
| 2019 | $1,674 | $155,700 | $44,700 | $111,000 |
| 2018 | $1,549 | $143,300 | $42,500 | $100,800 |
| 2017 | $1,471 | $131,100 | $40,500 | $90,600 |
| 2016 | $1,587 | $125,900 | $37,900 | $88,000 |
| 2015 | $1,601 | $105,332 | $29,554 | $75,778 |
| 2014 | -- | $106,967 | $28,622 | $78,345 |
| 2013 | -- | $88,110 | $24,518 | $63,592 |
Source: Public Records
Map
Nearby Homes