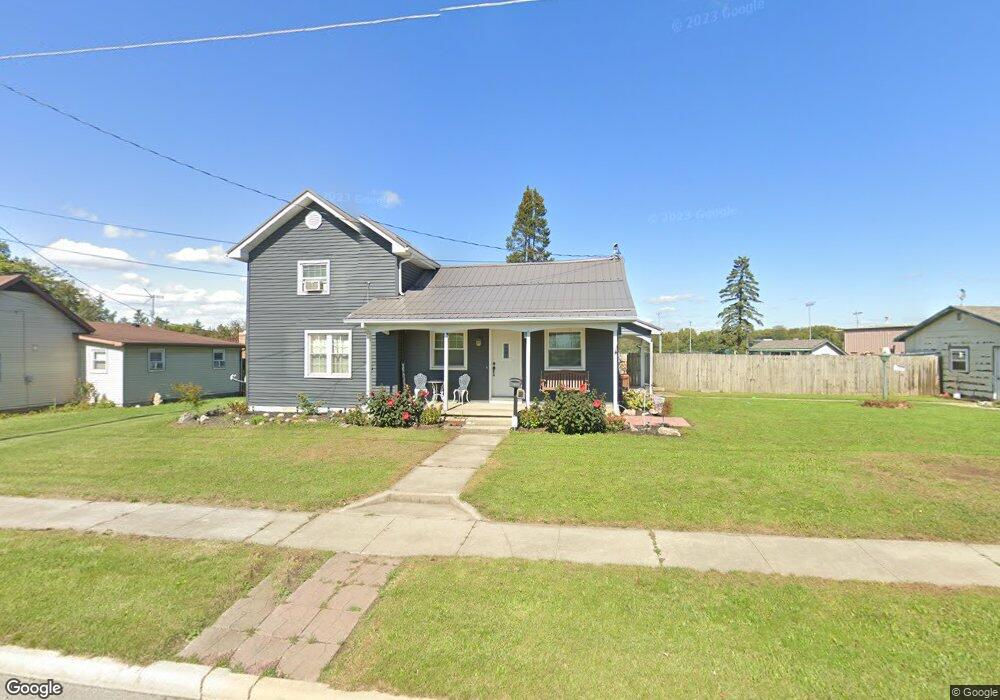
627 E Main St Butler, IN 46721
Estimated Value: $159,000 - $177,000
3
Beds
1
Bath
1,456
Sq Ft
$117/Sq Ft
Est. Value
About This Home
This home is located at 627 E Main St, Butler, IN 46721 and is currently estimated at $170,110, approximately $116 per square foot. 627 E Main St is a home located in DeKalb County with nearby schools including Eastside Junior/Senior High School.
Ownership History
Date
Name
Owned For
Owner Type
Purchase Details
Closed on
May 30, 2024
Sold by
Wilson John and Wilson Olive
Bought by
Wilson Olive
Current Estimated Value
Purchase Details
Closed on
Jan 15, 2007
Sold by
Wachovia Bank N A
Bought by
Wilson John and Wilson Olive
Home Financials for this Owner
Home Financials are based on the most recent Mortgage that was taken out on this home.
Original Mortgage
$55,000
Interest Rate
6.19%
Mortgage Type
New Conventional
Purchase Details
Closed on
Jan 26, 2006
Sold by
Kreischer Sandra S
Bought by
Wachovia Bank N A
Purchase Details
Closed on
Sep 1, 1996
Sold by
Johnson Bradley
Bought by
Obendorf Robert and Obendorf Marilee
Create a Home Valuation Report for This Property
The Home Valuation Report is an in-depth analysis detailing your home's value as well as a comparison with similar homes in the area
Home Values in the Area
Average Home Value in this Area
Purchase History
| Date | Buyer | Sale Price | Title Company |
|---|---|---|---|
| Wilson Olive | -- | None Listed On Document | |
| Wilson John | $55,000 | Res Title | |
| Wachovia Bank N A | $77,700 | None Available | |
| Obendorf Robert | $79,900 | -- |
Source: Public Records
Mortgage History
| Date | Status | Borrower | Loan Amount |
|---|---|---|---|
| Previous Owner | Wilson John | $55,000 |
Source: Public Records
Tax History
| Year | Tax Paid | Tax Assessment Tax Assessment Total Assessment is a certain percentage of the fair market value that is determined by local assessors to be the total taxable value of land and additions on the property. | Land | Improvement |
|---|---|---|---|---|
| 2024 | $1,072 | $145,100 | $15,900 | $129,200 |
| 2023 | $612 | $103,800 | $14,900 | $88,900 |
| 2022 | $660 | $96,300 | $13,600 | $82,700 |
| 2021 | $492 | $81,700 | $12,400 | $69,300 |
| 2020 | $412 | $79,800 | $12,400 | $67,400 |
| 2019 | $404 | $79,800 | $12,400 | $67,400 |
| 2018 | $351 | $65,900 | $12,400 | $53,500 |
| 2017 | $343 | $65,200 | $12,400 | $52,800 |
| 2016 | $300 | $56,800 | $12,300 | $44,500 |
| 2014 | $315 | $55,300 | $12,300 | $43,000 |
Source: Public Records
Map
Nearby Homes
- 618 E Main St
- 0 E Green St Unit 202539588
- 504 Erie St
- 502 E Main St
- 416 E Green St
- 104 S Park Ln
- 110 S Ash St
- 109 N Canal St
- 312 N Park Ln
- 212 E Main St
- 209 E Washington St
- 000 S Ivy Ln
- 409 N Pearl St
- 0 Main West St Unit MBR22085615
- 116 E Willow St
- 321 N Broadway St
- 108 E Monroe St
- 312 W Green St
- 533 W Liberty St
- 336 W Oak St
Your Personal Tour Guide
Ask me questions while you tour the home.