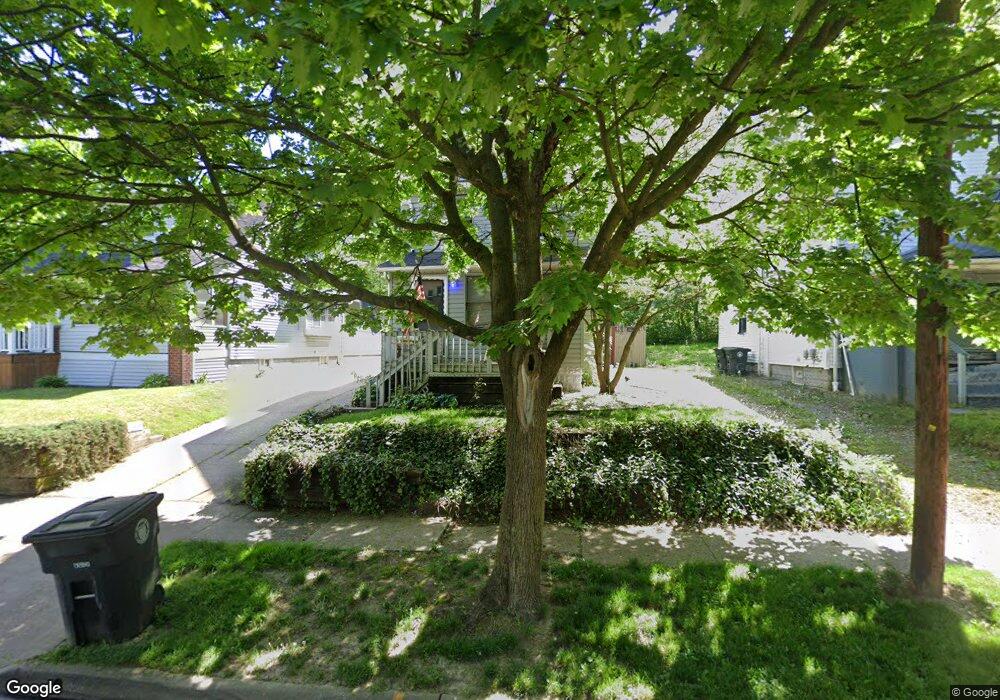
627 Merton Ave Akron, OH 44306
East Akron NeighborhoodEstimated Value: $82,000 - $100,000
3
Beds
1
Bath
1,314
Sq Ft
$67/Sq Ft
Est. Value
About This Home
This home is located at 627 Merton Ave, Akron, OH 44306 and is currently estimated at $88,267, approximately $67 per square foot. 627 Merton Ave is a home located in Summit County with nearby schools including Glover Community Learning Center, Kenmore Garfield Community Learning Center, and Case Preparatory Academy.
Ownership History
Date
Name
Owned For
Owner Type
Purchase Details
Closed on
Nov 8, 2019
Sold by
Carter Angela D
Bought by
Carter Alan B
Current Estimated Value
Purchase Details
Closed on
Nov 7, 1996
Sold by
Dawson Ethel C
Bought by
Carter Alan B and Carter Angela D
Home Financials for this Owner
Home Financials are based on the most recent Mortgage that was taken out on this home.
Original Mortgage
$35,300
Outstanding Balance
$3,531
Interest Rate
8.26%
Mortgage Type
New Conventional
Estimated Equity
$84,736
Create a Home Valuation Report for This Property
The Home Valuation Report is an in-depth analysis detailing your home's value as well as a comparison with similar homes in the area
Home Values in the Area
Average Home Value in this Area
Purchase History
| Date | Buyer | Sale Price | Title Company |
|---|---|---|---|
| Carter Alan B | -- | None Available | |
| Carter Alan B | $36,400 | -- |
Source: Public Records
Mortgage History
| Date | Status | Borrower | Loan Amount |
|---|---|---|---|
| Open | Carter Alan B | $35,300 |
Source: Public Records
Tax History
| Year | Tax Paid | Tax Assessment Tax Assessment Total Assessment is a certain percentage of the fair market value that is determined by local assessors to be the total taxable value of land and additions on the property. | Land | Improvement |
|---|---|---|---|---|
| 2025 | $1,118 | $20,364 | $3,917 | $16,447 |
| 2024 | $1,118 | $20,364 | $3,917 | $16,447 |
| 2023 | $1,118 | $20,364 | $3,917 | $16,447 |
| 2022 | $911 | $12,842 | $2,303 | $10,539 |
| 2021 | $912 | $12,842 | $2,303 | $10,539 |
| 2020 | $899 | $12,840 | $2,300 | $10,540 |
| 2019 | $1,114 | $14,710 | $3,890 | $10,820 |
| 2018 | $1,099 | $14,710 | $3,890 | $10,820 |
| 2017 | $1,131 | $14,710 | $3,890 | $10,820 |
| 2016 | $1,132 | $14,920 | $3,890 | $11,030 |
| 2015 | $1,131 | $14,920 | $3,890 | $11,030 |
| 2014 | $1,122 | $14,920 | $3,890 | $11,030 |
| 2013 | $1,108 | $15,030 | $3,890 | $11,140 |
Source: Public Records
Map
Nearby Homes
Your Personal Tour Guide
Ask me questions while you tour the home.