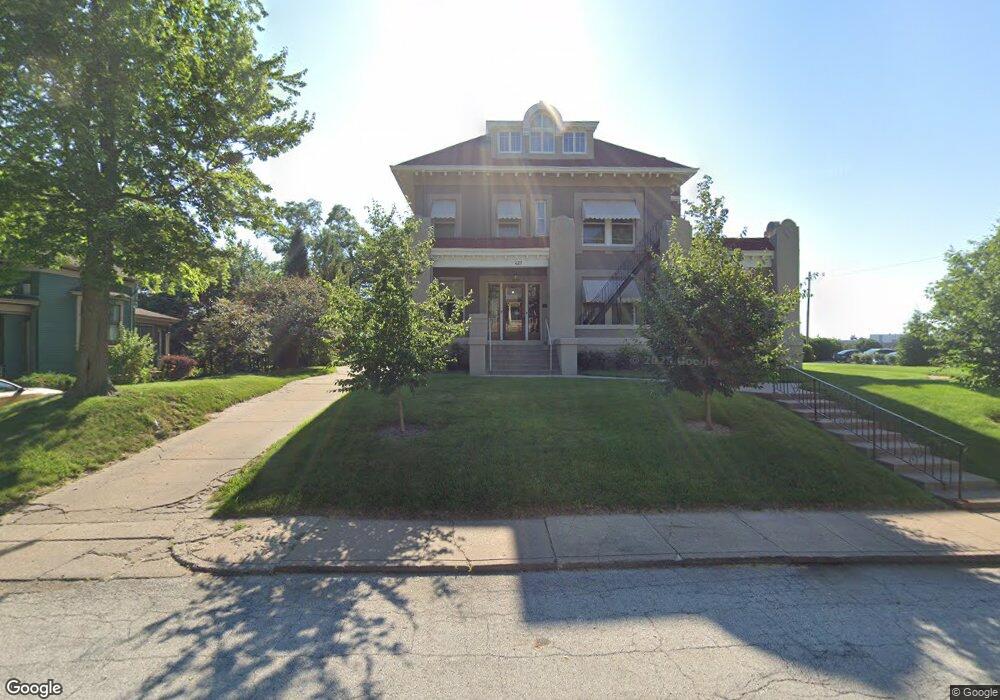
627 N Ripley C-12 St Davenport, IA 52803
Central Davenport NeighborhoodEstimated Value: $132,000 - $329,429
4
Beds
2
Baths
2,240
Sq Ft
$120/Sq Ft
Est. Value
About This Home
This home is located at 627 N Ripley C-12 St, Davenport, IA 52803 and is currently estimated at $267,857, approximately $119 per square foot. 627 N Ripley C-12 St is a home with nearby schools including Jefferson Elementary School, Madison Elementary School, and Frank L. Smart Intermediate School.
Ownership History
Date
Name
Owned For
Owner Type
Purchase Details
Closed on
Oct 6, 2025
Sold by
Grandview Cooperative
Bought by
Pattschull Bryan W and Cordes David L
Current Estimated Value
Purchase Details
Closed on
Jun 23, 2020
Sold by
Bank Of New York Mellon Trust Company Na
Bought by
Gorbach Alexander
Purchase Details
Closed on
Jul 31, 2015
Sold by
Miner Patrick J and Miner Roxanne M
Bought by
Arb John J Von and Arb Phyllis H Von
Purchase Details
Closed on
Dec 20, 2013
Sold by
Pattschull Bryan W and Cordes David L
Bought by
Grandview Cooperative
Purchase Details
Closed on
Apr 13, 2012
Sold by
Honts Kenneth L
Bought by
Honts Kenneth L and Honts Sandi K
Create a Home Valuation Report for This Property
The Home Valuation Report is an in-depth analysis detailing your home's value as well as a comparison with similar homes in the area
Home Values in the Area
Average Home Value in this Area
Purchase History
| Date | Buyer | Sale Price | Title Company |
|---|---|---|---|
| Pattschull Bryan W | -- | None Listed On Document | |
| Gorbach Alexander | $29,000 | None Available | |
| Arb John J Von | $7,000 | Attorney | |
| Grandview Cooperative | -- | None Available | |
| Honts Kenneth L | $34,000 | None Available |
Source: Public Records
Tax History Compared to Growth
Tax History
| Year | Tax Paid | Tax Assessment Tax Assessment Total Assessment is a certain percentage of the fair market value that is determined by local assessors to be the total taxable value of land and additions on the property. | Land | Improvement |
|---|---|---|---|---|
| 2025 | $6,190 | $346,320 | $26,100 | $320,220 |
| 2024 | $6,628 | $346,320 | $26,100 | $320,220 |
| 2023 | $5,128 | $380,030 | $26,100 | $353,930 |
| 2022 | $5,040 | $240,110 | $26,100 | $214,010 |
| 2021 | $5,040 | $234,890 | $26,100 | $208,790 |
| 2020 | $5,066 | $233,760 | $26,100 | $207,660 |
| 2019 | $4,808 | $214,310 | $25,520 | $188,790 |
| 2018 | $4,706 | $214,310 | $25,520 | $188,790 |
| 2017 | $1,192 | $214,310 | $25,520 | $188,790 |
| 2016 | $4,342 | $198,300 | $0 | $0 |
| 2015 | $4,342 | $197,400 | $0 | $0 |
| 2014 | $4,384 | $0 | $0 | $0 |
| 2013 | $6,552 | $0 | $0 | $0 |
| 2012 | -- | $171,500 | $24,500 | $147,000 |
Source: Public Records
Map
Nearby Homes