Estimated Value: $452,000 - $624,000
3
Beds
3
Baths
2,334
Sq Ft
$245/Sq Ft
Est. Value
About This Home
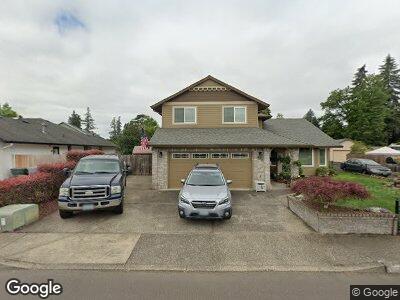
This home is located at 627 S Knott St, Canby, OR 97013 and is currently estimated at $572,410, approximately $245 per square foot. 627 S Knott St is a home located in Clackamas County with nearby schools including Philander Lee Elementary School, Baker Prairie Middle School, and Canby High School.
Ownership History
Date
Name
Owned For
Owner Type
Purchase Details
Closed on
Mar 12, 2021
Sold by
Sandner Ronald A and Sandner Mary B
Bought by
Sandner Ronald A and Sandner Mary B
Current Estimated Value
Home Financials for this Owner
Home Financials are based on the most recent Mortgage that was taken out on this home.
Original Mortgage
$100,000
Interest Rate
2.7%
Mortgage Type
New Conventional
Purchase Details
Closed on
May 22, 2012
Sold by
Sandner Ronald A and Sandner Mary B
Bought by
Sandner Ronald A and Sandner Mary B
Home Financials for this Owner
Home Financials are based on the most recent Mortgage that was taken out on this home.
Original Mortgage
$25,000
Interest Rate
4.05%
Mortgage Type
Credit Line Revolving
Create a Home Valuation Report for This Property
The Home Valuation Report is an in-depth analysis detailing your home's value as well as a comparison with similar homes in the area
Home Values in the Area
Average Home Value in this Area
Purchase History
| Date | Buyer | Sale Price | Title Company |
|---|---|---|---|
| Sandner Ronald A | -- | Accommodation | |
| Sandner Ronald A | -- | Chicago Title | |
| Sandner Ronald A | -- | None Available |
Source: Public Records
Mortgage History
| Date | Status | Borrower | Loan Amount |
|---|---|---|---|
| Closed | Sandner Ronald A | $100,000 | |
| Closed | Sandner Ronald A | $142,000 | |
| Closed | Sandner Ronald A | $25,000 | |
| Closed | Sander Ronald A | $206,000 | |
| Closed | Sandner Ronald A | $227,000 | |
| Closed | Sandner Ronald A | $228,000 |
Source: Public Records
Tax History Compared to Growth
Tax History
| Year | Tax Paid | Tax Assessment Tax Assessment Total Assessment is a certain percentage of the fair market value that is determined by local assessors to be the total taxable value of land and additions on the property. | Land | Improvement |
|---|---|---|---|---|
| 2023 | $5,939 | $325,105 | $0 | $0 |
| 2022 | $5,463 | $315,636 | $0 | $0 |
| 2021 | $5,260 | $306,443 | $0 | $0 |
| 2020 | $5,166 | $297,518 | $0 | $0 |
| 2019 | $4,920 | $288,853 | $0 | $0 |
| 2018 | $4,810 | $280,440 | $0 | $0 |
| 2017 | $4,688 | $272,272 | $0 | $0 |
| 2016 | $4,532 | $264,342 | $0 | $0 |
| 2015 | $4,376 | $256,643 | $0 | $0 |
| 2014 | $4,250 | $249,168 | $0 | $0 |
Source: Public Records
Map
Nearby Homes
- 257 SE 3rd Ave
- 220 SE 3rd Ave
- 423 SE 7th Ave
- 217 S Knott St
- 620 SE 2nd Ave Unit 21
- 620 SE 2nd Ave Unit 42
- 620 SE 2nd Ave
- 620 SE 2nd Ave Unit 34
- 620 SE 2nd Ave Unit 7
- 620 SE 2nd (#7) Ave Unit 7
- 480 S Pine St
- 835 S Elm Ct
- 1111 SE 3rd Ave Unit 14
- 835 SE 1st Ave
- 835 SE 1st Ave Unit 17
- 835 SE 1st Ave Unit 14
- 201 SE 16th Ave
- 217 S -223 Knott St
- 644 S Ponderosa Ct
- 468 NE 3rd Ave