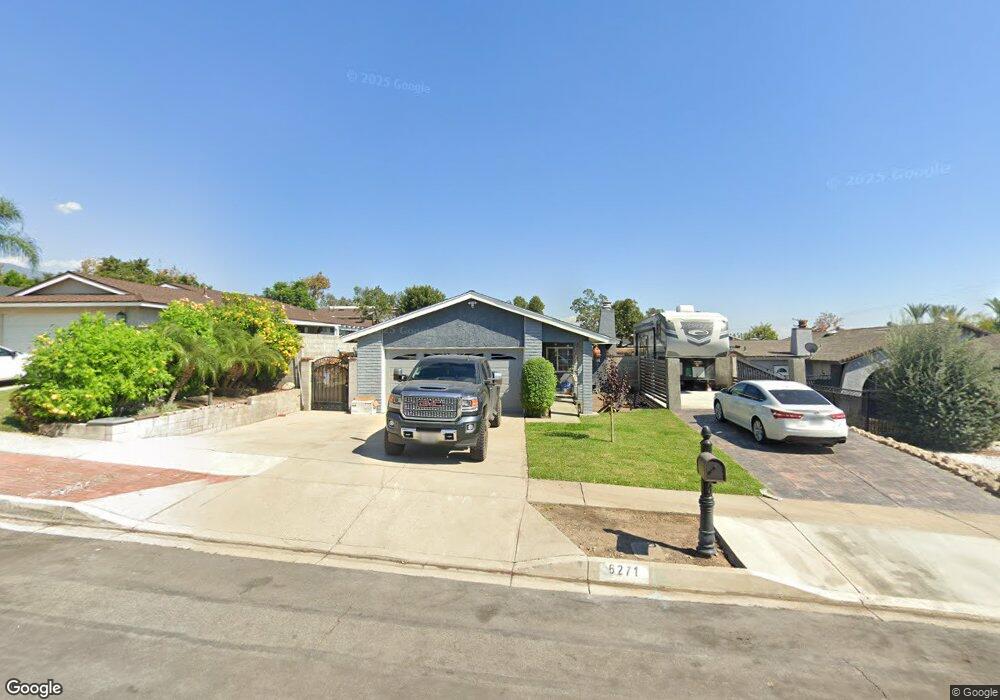
6271 Cartilla Ave Rancho Cucamonga, CA 91737
Estimated Value: $663,000 - $741,000
3
Beds
2
Baths
1,255
Sq Ft
$556/Sq Ft
Est. Value
About This Home
This home is located at 6271 Cartilla Ave, Rancho Cucamonga, CA 91737 and is currently estimated at $698,159, approximately $556 per square foot. 6271 Cartilla Ave is a home located in San Bernardino County with nearby schools including Hermosa Elementary, Vineyard Junior High, and Los Osos High.
Ownership History
Date
Name
Owned For
Owner Type
Purchase Details
Closed on
Jan 12, 2016
Sold by
Magruder Danielle Patricia and Stewart Danielle
Bought by
Magruder Danielle Patricia
Current Estimated Value
Home Financials for this Owner
Home Financials are based on the most recent Mortgage that was taken out on this home.
Original Mortgage
$320,000
Outstanding Balance
$254,169
Interest Rate
3.92%
Mortgage Type
New Conventional
Estimated Equity
$443,990
Purchase Details
Closed on
Feb 21, 2003
Sold by
Sclafani James and Sclafani Sue Ann
Bought by
Magruder Bryan and Stewart Danielle
Home Financials for this Owner
Home Financials are based on the most recent Mortgage that was taken out on this home.
Original Mortgage
$213,275
Interest Rate
3.87%
Mortgage Type
Purchase Money Mortgage
Create a Home Valuation Report for This Property
The Home Valuation Report is an in-depth analysis detailing your home's value as well as a comparison with similar homes in the area
Home Values in the Area
Average Home Value in this Area
Purchase History
| Date | Buyer | Sale Price | Title Company |
|---|---|---|---|
| Magruder Danielle Patricia | -- | Wfg Title Company Of Ca | |
| Magruder Bryan | $224,500 | Fidelity National Title |
Source: Public Records
Mortgage History
| Date | Status | Borrower | Loan Amount |
|---|---|---|---|
| Open | Magruder Danielle Patricia | $320,000 | |
| Closed | Magruder Bryan | $213,275 |
Source: Public Records
Tax History Compared to Growth
Tax History
| Year | Tax Paid | Tax Assessment Tax Assessment Total Assessment is a certain percentage of the fair market value that is determined by local assessors to be the total taxable value of land and additions on the property. | Land | Improvement |
|---|---|---|---|---|
| 2025 | $3,807 | $350,012 | $81,287 | $268,725 |
| 2024 | $3,807 | $343,149 | $79,693 | $263,456 |
| 2023 | $3,722 | $336,420 | $78,130 | $258,290 |
| 2022 | $3,713 | $329,823 | $76,598 | $253,225 |
| 2021 | $3,711 | $323,356 | $75,096 | $248,260 |
| 2020 | $3,559 | $320,040 | $74,326 | $245,714 |
| 2019 | $3,600 | $313,765 | $72,869 | $240,896 |
| 2018 | $3,519 | $307,613 | $71,440 | $236,173 |
| 2017 | $3,125 | $280,161 | $70,039 | $210,122 |
| 2016 | $3,040 | $274,668 | $68,666 | $206,002 |
| 2015 | $3,021 | $270,543 | $67,635 | $202,908 |
| 2014 | $2,936 | $265,243 | $66,310 | $198,933 |
Source: Public Records
Map
Nearby Homes
- 10393 Cartilla Ct
- 6162 Mayberry Ave
- 6281 Kinlock Ave
- 10655 Lemon Ave Unit 2402
- 10655 Lemon Ave Unit 2703
- 10655 Lemon Ave Unit 2605
- 10655 Lemon Ave Unit 1710
- 10655 Lemon Ave Unit 4004
- 10655 Lemon Ave Unit 1508
- 10655 Lemon Ave Unit 4009
- 10655 Lemon Ave Unit 3613
- 10655 Lemon Ave Unit 3912
- 10141 Orange St
- 10121 Banyan St
- 10123 Finch Ave
- 6516 Alameda Ave
- 6600 Montresor Place
- 6644 Brissac Place
- 6110 Cantabria Ave
- 10456 Hamilton St
- 6261 Cartilla Ave
- 6279 Cartilla Ave
- 6251 Cartilla Ave
- 10410 Lemon Ave
- 6270 Cartilla Ave
- 6243 Cartilla Ave
- 6278 Cartilla Ave
- 6260 Cartilla Ave
- 10370 Lemon Ave
- 6233 Cartilla Ave
- 6242 Cartilla Ave
- 6267 Revere Ave
- 6232 Cartilla Ave
- 6277 Revere Ave
- 6223 Cartilla Ave
- 6257 Revere Ave
- 6287 Revere Ave
- 6247 Revere Ave
- 6325 Revere Ave