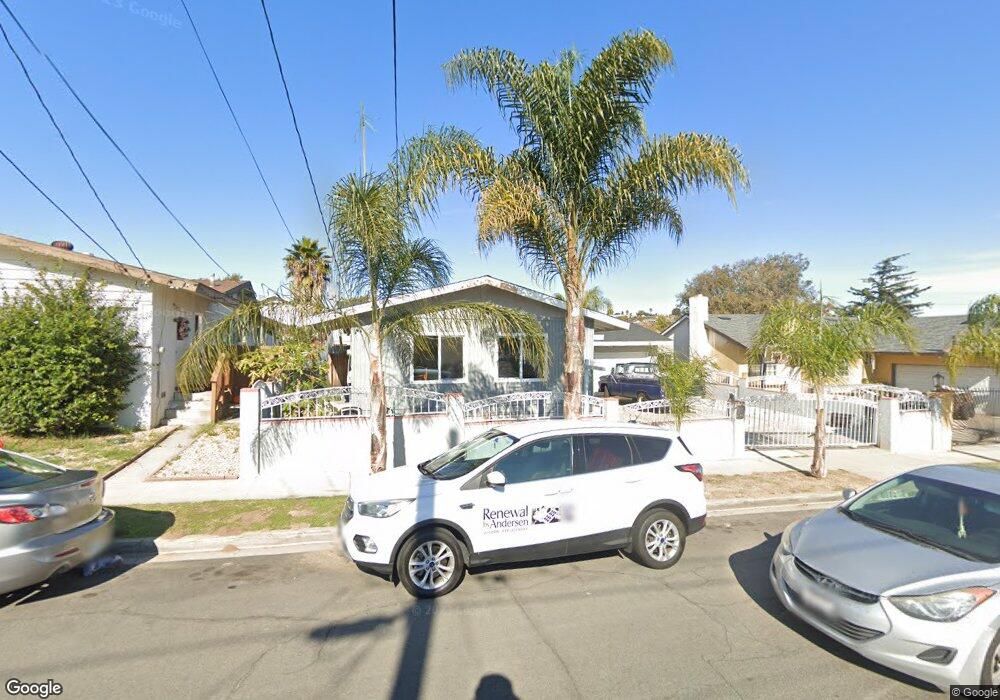
6272 Childs Ave San Diego, CA 92139
Paradise Hills NeighborhoodEstimated Value: $679,485 - $748,000
3
Beds
1
Bath
946
Sq Ft
$758/Sq Ft
Est. Value
About This Home
This home is located at 6272 Childs Ave, San Diego, CA 92139 and is currently estimated at $716,621, approximately $757 per square foot. 6272 Childs Ave is a home located in San Diego County with nearby schools including Bell Middle School, Morse High School, and Faithful Ambassadors Bible Baptist Academy.
Ownership History
Date
Name
Owned For
Owner Type
Purchase Details
Closed on
Apr 2, 2024
Sold by
Chavez Antonio C and Chavez Maria J
Bought by
Campos Julio Cesar
Current Estimated Value
Home Financials for this Owner
Home Financials are based on the most recent Mortgage that was taken out on this home.
Original Mortgage
$692,230
Interest Rate
6.88%
Mortgage Type
FHA
Purchase Details
Closed on
May 11, 2001
Sold by
Selmon Robert E and Jenkins Colethea Y
Bought by
Chavez Antonio C and Chavez Maria J
Home Financials for this Owner
Home Financials are based on the most recent Mortgage that was taken out on this home.
Original Mortgage
$148,100
Interest Rate
7.1%
Purchase Details
Closed on
May 4, 1998
Sold by
Joan Drew M and Nissa Erin
Bought by
Smith Christopher W
Create a Home Valuation Report for This Property
The Home Valuation Report is an in-depth analysis detailing your home's value as well as a comparison with similar homes in the area
Home Values in the Area
Average Home Value in this Area
Purchase History
| Date | Buyer | Sale Price | Title Company |
|---|---|---|---|
| Campos Julio Cesar | $705,000 | Fidelity National Title | |
| Chavez Antonio C | $198,000 | New Century Title Company | |
| Smith Christopher W | $50,000 | Commonwealth Land Title Co |
Source: Public Records
Mortgage History
| Date | Status | Borrower | Loan Amount |
|---|---|---|---|
| Previous Owner | Campos Julio Cesar | $692,230 | |
| Previous Owner | Chavez Antonio C | $148,100 | |
| Closed | Chavez Antonio C | $40,000 |
Source: Public Records
Tax History Compared to Growth
Tax History
| Year | Tax Paid | Tax Assessment Tax Assessment Total Assessment is a certain percentage of the fair market value that is determined by local assessors to be the total taxable value of land and additions on the property. | Land | Improvement |
|---|---|---|---|---|
| 2025 | $3,471 | $719,100 | $612,000 | $107,100 |
| 2024 | $3,471 | $286,746 | $123,331 | $163,415 |
| 2023 | $3,392 | $281,124 | $120,913 | $160,211 |
| 2022 | $3,300 | $275,613 | $118,543 | $157,070 |
| 2021 | $3,276 | $270,210 | $116,219 | $153,991 |
| 2020 | $3,236 | $267,441 | $115,028 | $152,413 |
| 2019 | $3,177 | $262,198 | $112,773 | $149,425 |
| 2018 | $2,970 | $257,058 | $110,562 | $146,496 |
| 2017 | $2,897 | $252,019 | $108,395 | $143,624 |
| 2016 | $2,849 | $247,078 | $106,270 | $140,808 |
| 2015 | $2,806 | $243,367 | $104,674 | $138,693 |
| 2014 | $2,761 | $238,601 | $102,624 | $135,977 |
Source: Public Records
Map
Nearby Homes
- 6253 Rancho Hills Dr
- 3161 Manos Dr
- 2956 Lucia Jade Loop
- 6302 Clyde Ave
- 2910 Lucia Jade Loop
- 2745 Kausman St
- 6442 Seascape Dr
- 6127 Winchester St
- 2579 Reo Dr
- 2862 Callejon
- 6759 Parkside Ave
- 5865 Reo Terrace Unit B
- 5865 Reo Terrace Unit A
- 5875 Reo Terrace Unit E
- 5875 Reo Terrace Unit C
- 6767 Parkside Ave
- 5762 Calle Sal si Puedes
- 6795 Parkside Ave
- 6771 Parkside Ave
- 2761 Hopkins St
- 6266 Childs Ave
- 6278 Childs Ave
- 6279 Plateau Dr
- 6260 Childs Ave
- 6284 Childs Ave
- 6271 Plateau Dr
- 6271 Plateau Dr
- 6285 Plateau Dr
- 6263 Plateau Dr
- 6291 Plateau Dr
- 6271 Childs Ave
- 6254 Childs Ave
- 6265 Childs Ave
- 6277 Childs Ave
- 2786 Landscape Dr
- 6292 Childs Ave
- 6259 Childs Ave
- 6257 Plateau Dr
- 6283 Childs Ave
- 2778 Landscape Dr